One of the most crucial tools that technical analyzers employ is the trendline. Technical analysts seek for patterns in price action rather than historical company performance or other fundamentals. Technical analysts can ascertain the present direction of market prices with the aid of a trendline.
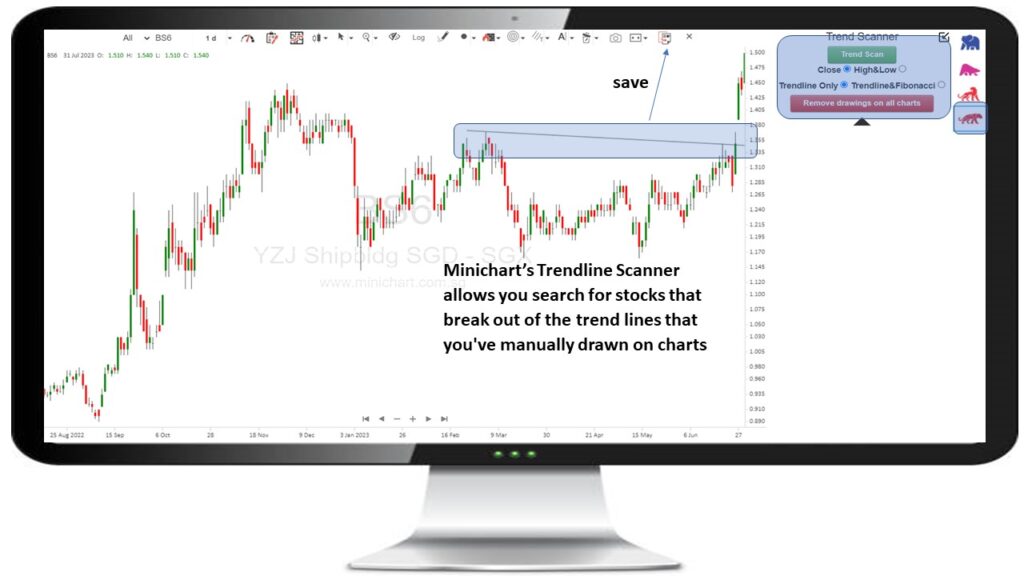
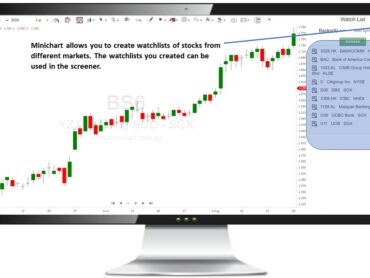
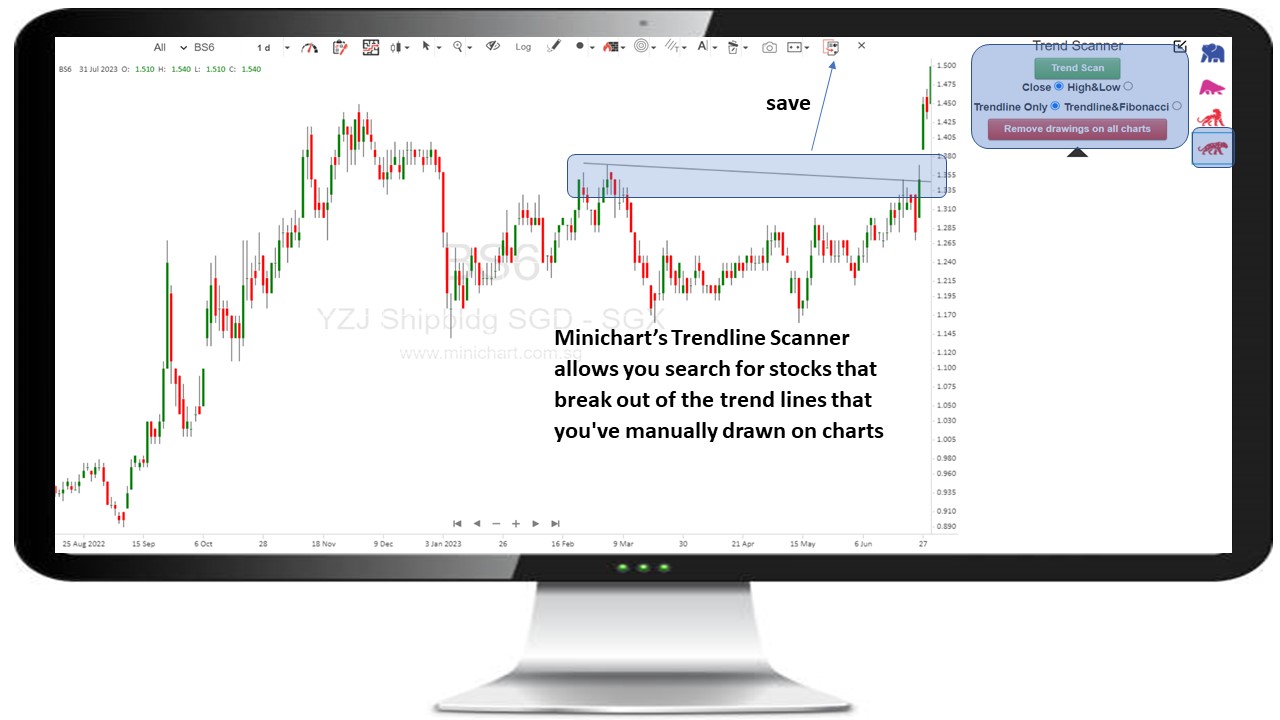
Minichart’s Trendline Scanner allows you search for stocks that break out of the trend lines that you’ve manually drawn on charts
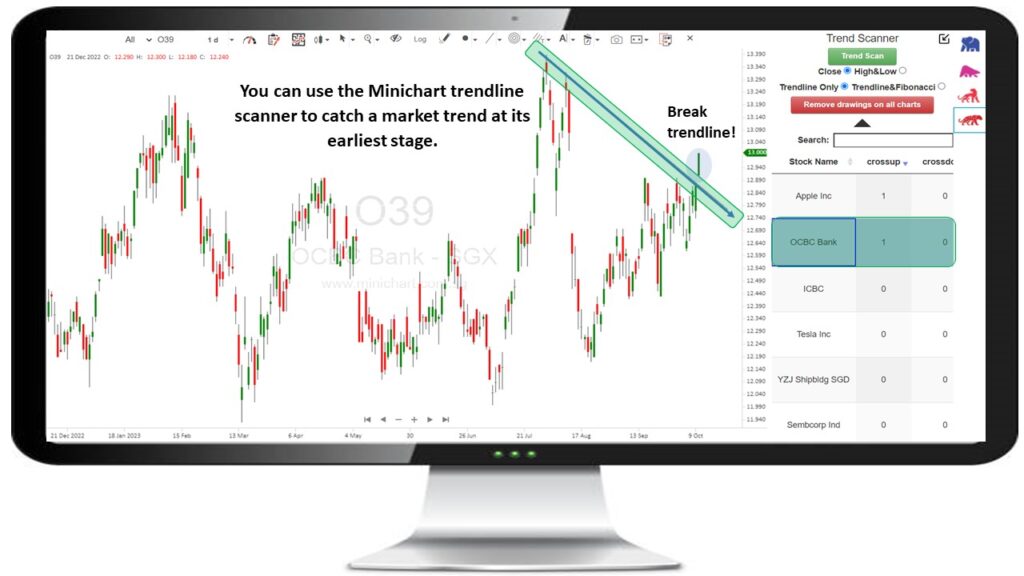
You can use the Minichart trendline scanner to catch a market trend at its earliest stage.
How to draw a trend line?
In a decline, trend lines are formed above the price. In an uptrend, two lows must be connected by a straight line. In a downtrend, two highs must be connected by a straight line. For the trend line to be considered genuine, it must connect at least three highs or lows.
Three Essentials for Skillfully Drawing Trend Lines
Effective trend line sketching requires adherence to three crucial principles.
- The trend lines produced by the higher time frames are consistently the most trustworthy, so begin there and work your way down.
- The majority of trend lines you see will overlap somewhat with a candle’s high or low, but the key is to get as many touches as you can without going through the candle’s body.
- Never try to make a trend line fit on your chart; if it doesn’t, it isn’t legitimate and isn’t worth including.