Minichart system has a variety of drawing tools, indicators multi-charts function that can help you to analyse the market easily!
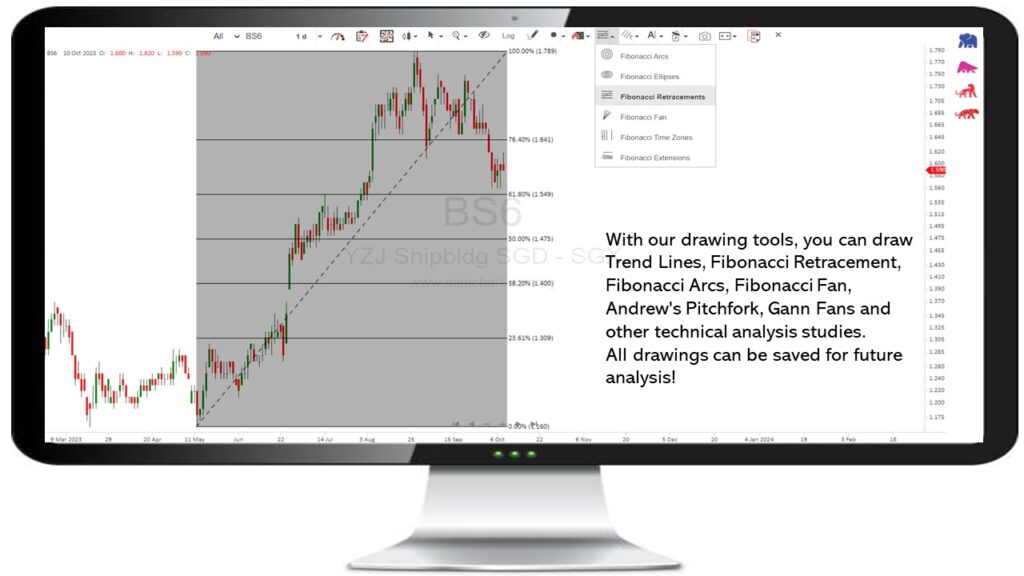
With our drawing tools, you can draw Trend Lines, Fibonacci Retracement, Fibonacci Arcs, Fibonacci Fan, Andrew’s Pitchfork, Gann Fans and other technical analysis studies.
All drawings can be saved for future analysis!
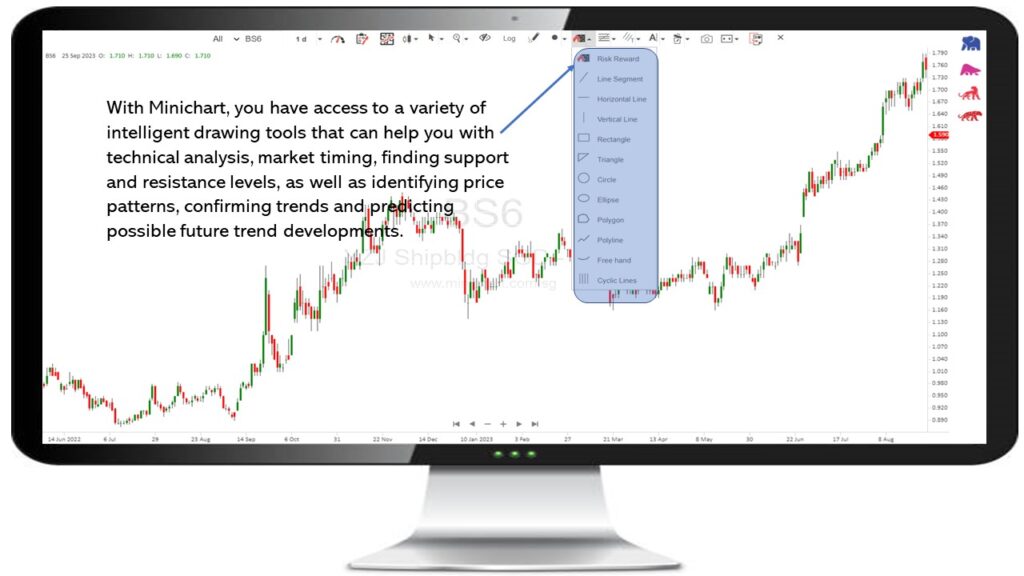
With Minichart, you have access to a variety of intelligent drawing tools that can help you with technical analysis, market timing, finding support and resistance levels, as well as identifying price patterns, confirming trends and predicting possible future trend developments.
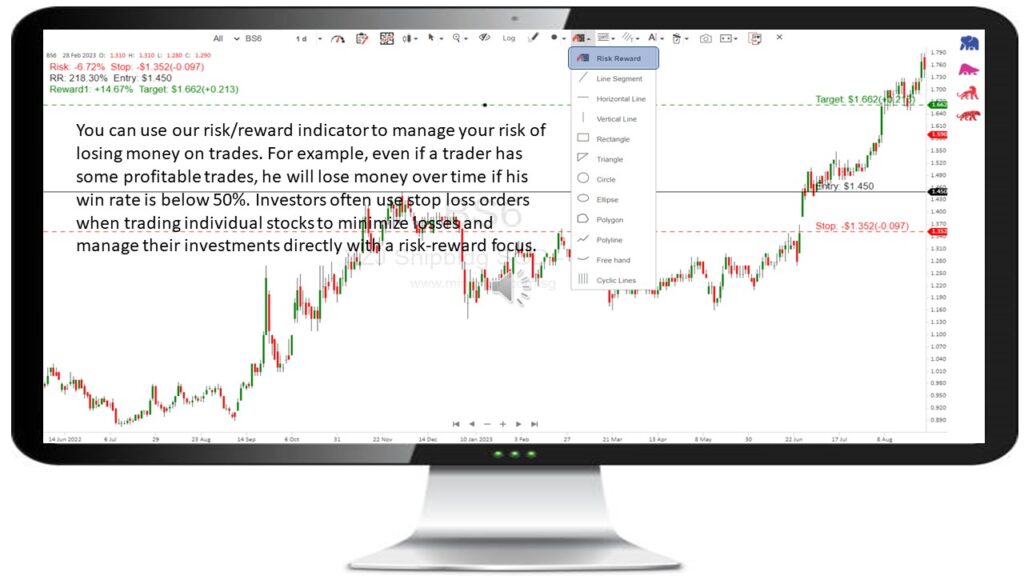
You can use our risk/reward indicator to manage your risk of losing money on trades. For example, even if a trader has some profitable trades, he will lose money over time if his win rate is below 50%. Investors often use stop loss orders when trading individual stocks to minimize losses and manage their investments directly with a risk-reward focus. 👍
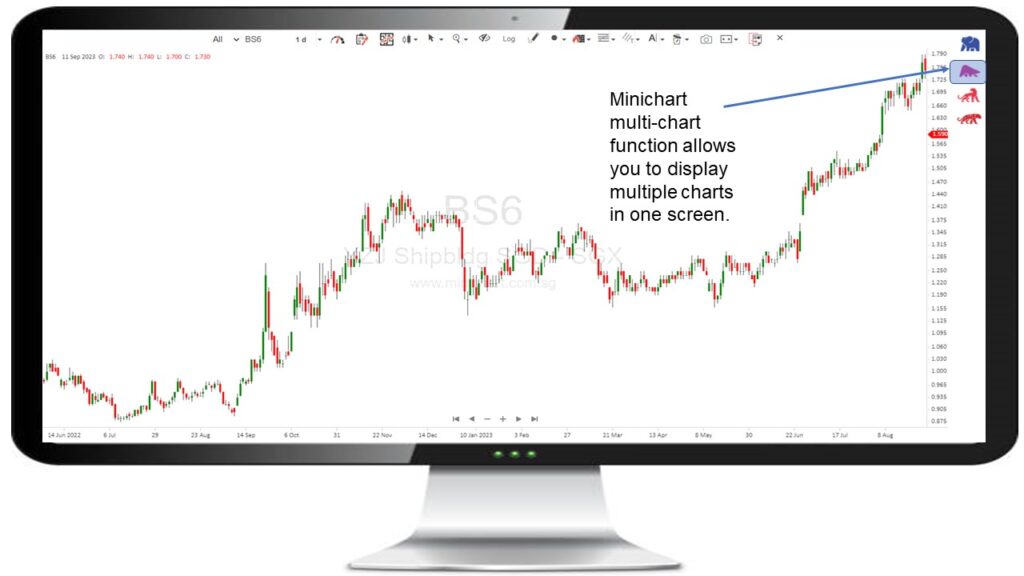
Minichart multi-chart function allows you to display multiple charts in one screen. This will allow you to analyse in details various indicators and timeframe of the same or different symbols.
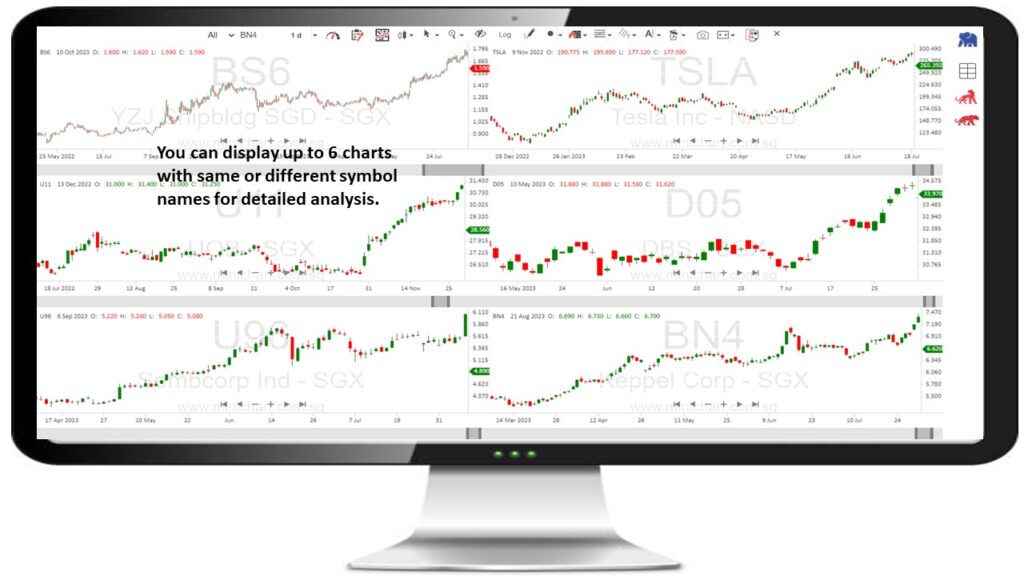
You can display up to 6 charts with same or different symbol names for detailed analysis.
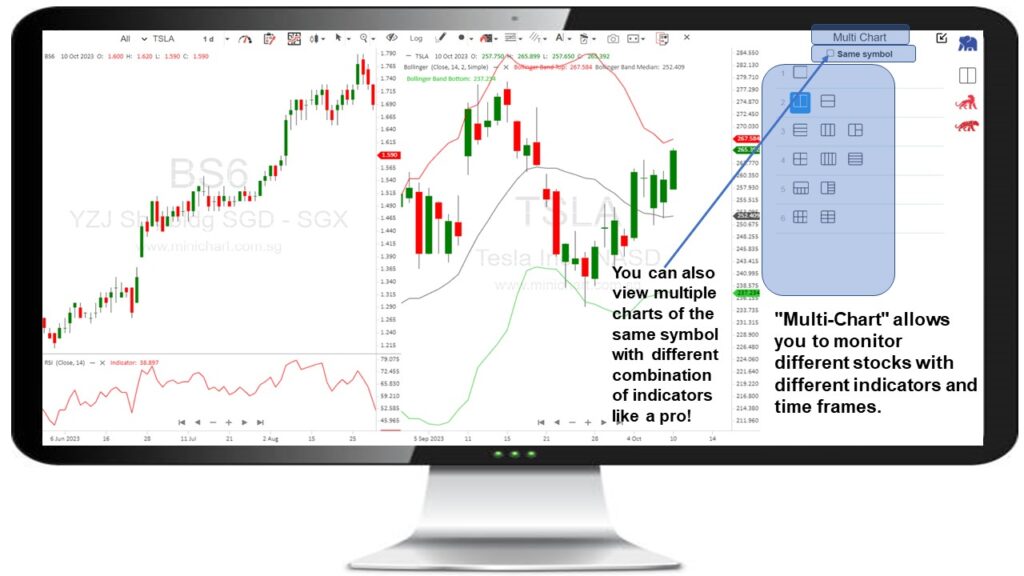
“Multi-Chart” allows you to monitor different stocks with different indicators and time frames. You can also view multiple charts of the same symbol with different combination of indicators like a pro! 🤭
