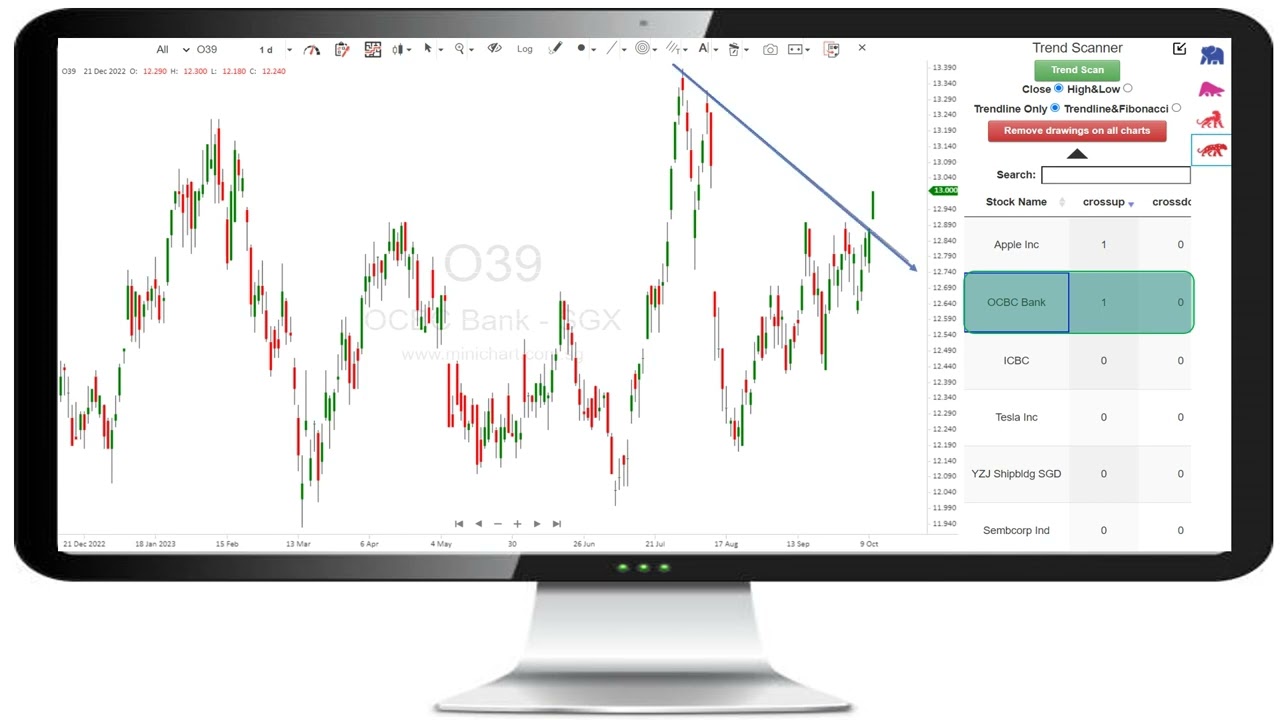
Wednesday, September 17th, 2025

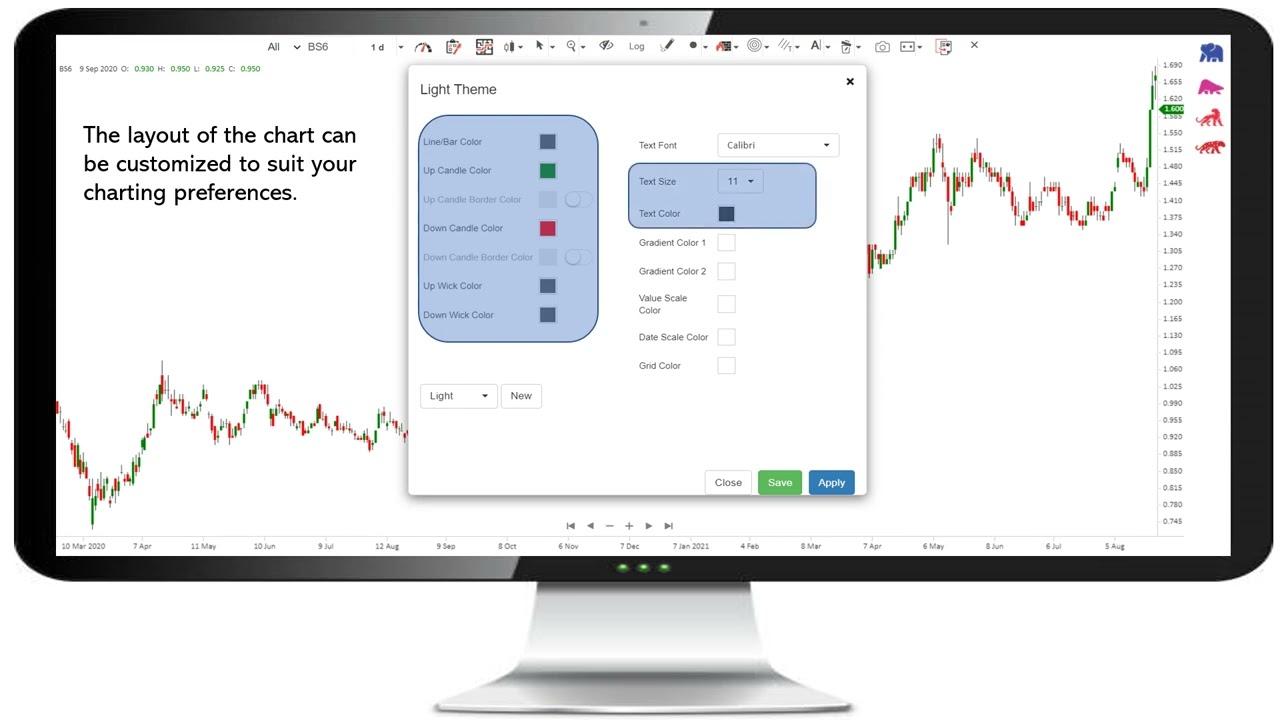
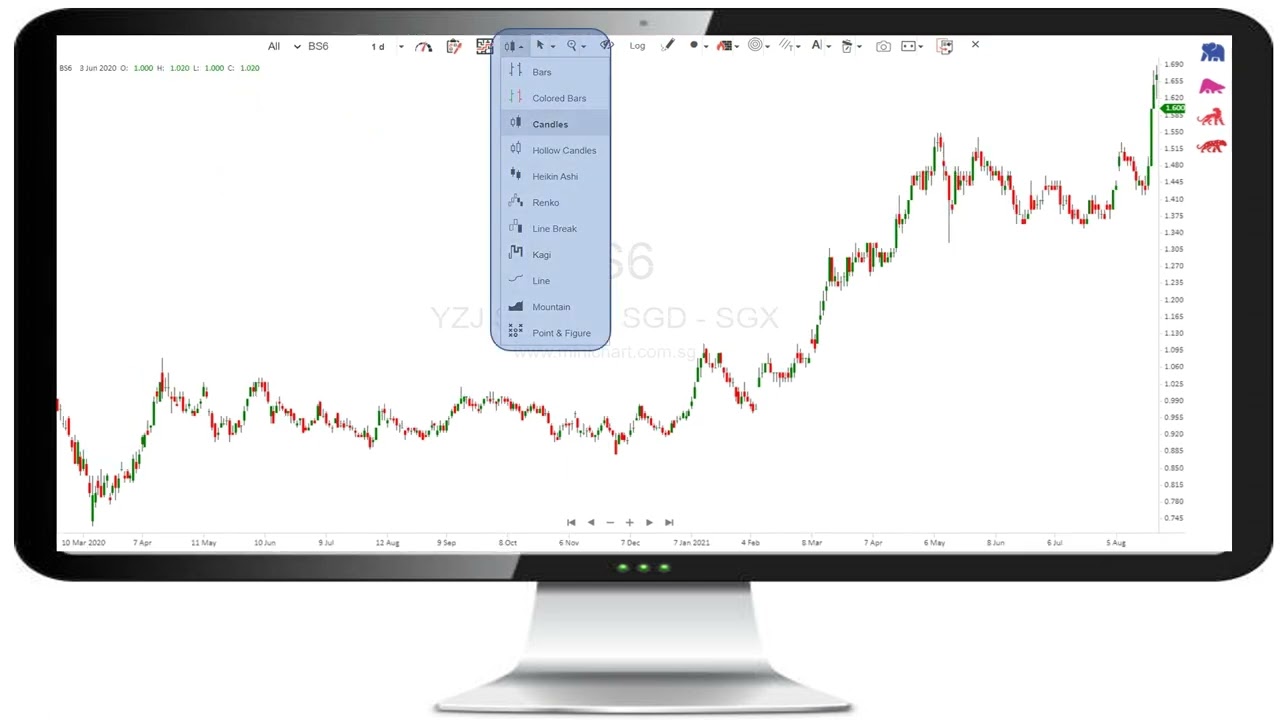
How to use Minichart drawing tools?

Minichart offers a variety of effective drawing tools to assist you in identifying market trends. The Chart menu provides access to the drawing tools.
Anywhere on the chart, you may add text notes by choosing Annotation from the Drawing Tools menu.

You can create Fibonacci extension and retracement grids to find hidden levels of support and resistance that could be relevant at different points in a position’s existence. The grid ratios that closely match gaps, moving averages, previous highs and lows, and other technical indicators are the most reliable Fib reversal signs. Retracement grids can be used to create intricate entry and exit plans, while extension grids can be used to find price goals and adjust risk management parameters.

629 views

Leave a Reply

Your email address will not be published. Required fields are marked *

Hiap Seng Industries Reports 339% Profit Increase in Latest Half-Year Results

Financial Analysis: Net Profit Growth of 339% – Hiap Seng Industries Limited Financial Analysis: Net Profit Growth of 339% – Hiap Seng Industries Limited Business Description Hiap Seng Industries Limited is an investment holding...

Bank Central Asia (BBCA) Stock Analysis: Strong Growth and Resilient Earnings Forecast for 2025

Comprehensive Analysis of Bank Central Asia (BBCA): Resilient Growth and Key Insights Comprehensive Analysis of Bank Central Asia (BBCA): Resilient Growth and Key Insights Report Date: January 26, 2025 Broker: PT Maybank Sekuritas Indonesia...

SingTel Stock Analysis: Bullish Short-Term Outlook & Key Support/Resistance Levels (July 2025)

Broker: Lim & Tan Securities Date of Report: 07 July 2025 SingTel Share Price Outlook: Bullish Momentum Signals Upside Potential for Investors Overview: SingTel Poised for Short-Term Gains SingTel, a key player in Singapore’s...