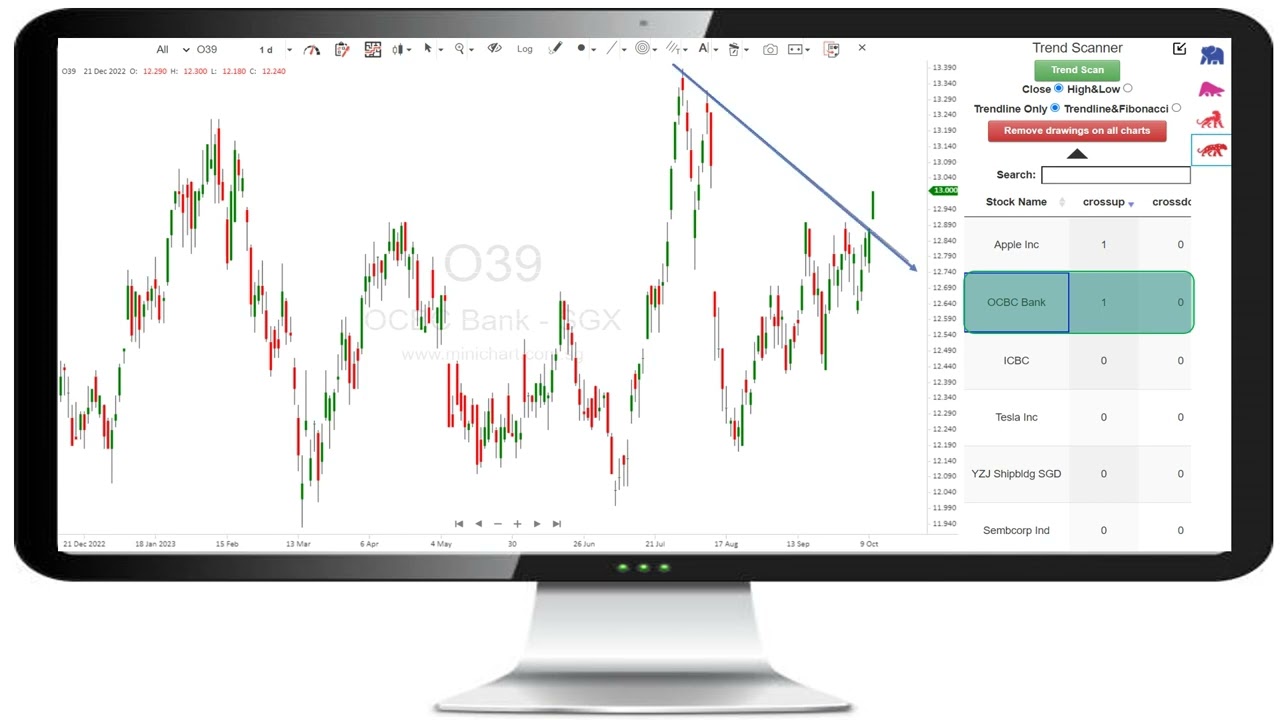
Saturday, July 27th, 2024

How to use Minichart’s technical analysis scanner?

Technical indicators’ efficacy varies with the trading method, timeframe, and market environment. In order to find the mix that works best for their objectives and risk tolerance, traders must thus experiment with a variety of indicators and techniques.

Minichart TA scanner is designed to help you to simplify the process and create advance scanning conditions effortlessly!

296 views

Leave a Reply

Your email address will not be published. Required fields are marked *

How to use Minichart drawing tools and multi charts?

Minichart system has a variety of drawing tools, indicators multi-charts function that can help you to analyse the market easily! With our drawing tools, you can draw Trend Lines, Fibonacci Retracement, Fibonacci Arcs, Fibonacci...

Find out which Singapore mid-cap stock have a 30% upside potential

they have secured substantial orders and expanded operational capacity.

This Malaysian stock has a sizable construction order book & unbilled property sales

Gamuda Bhd reported a 7.29% increase in net profit to RM208.8 million in the second quarter ended January 31, 2024 (2QFY2024), up from RM194.62 million a year earlier, driven by higher revenue from its...