Previous Post
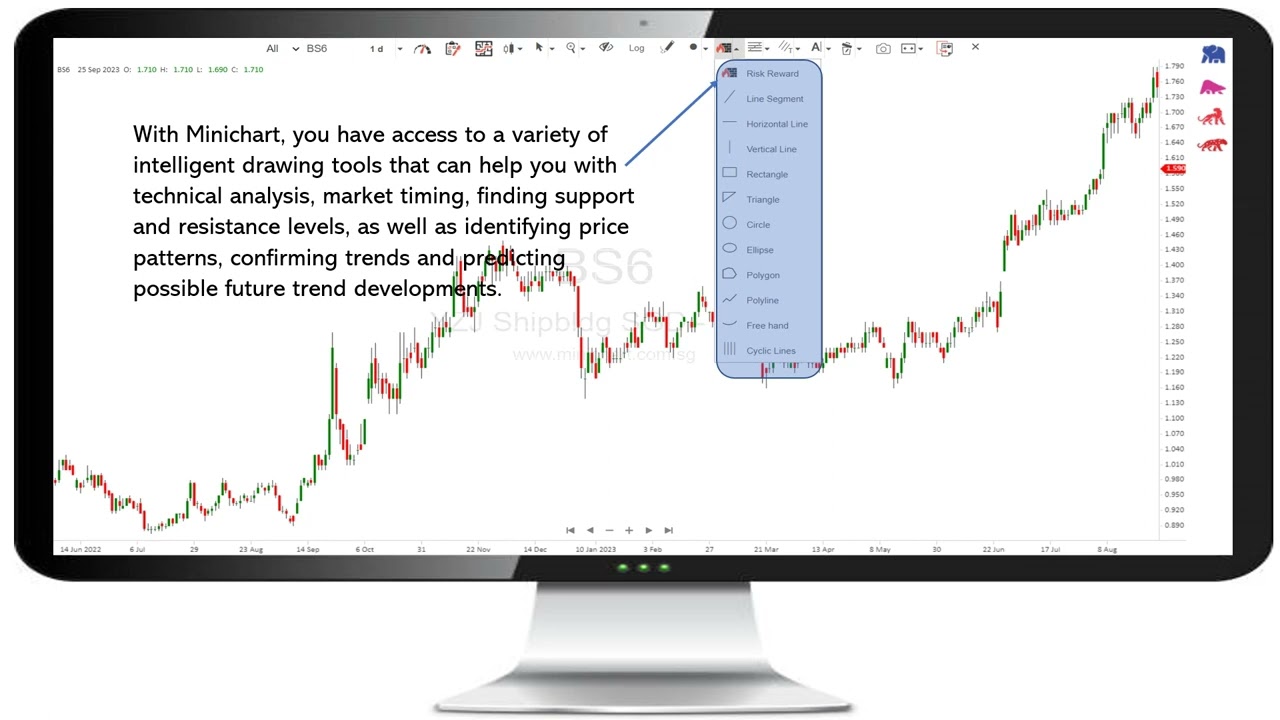
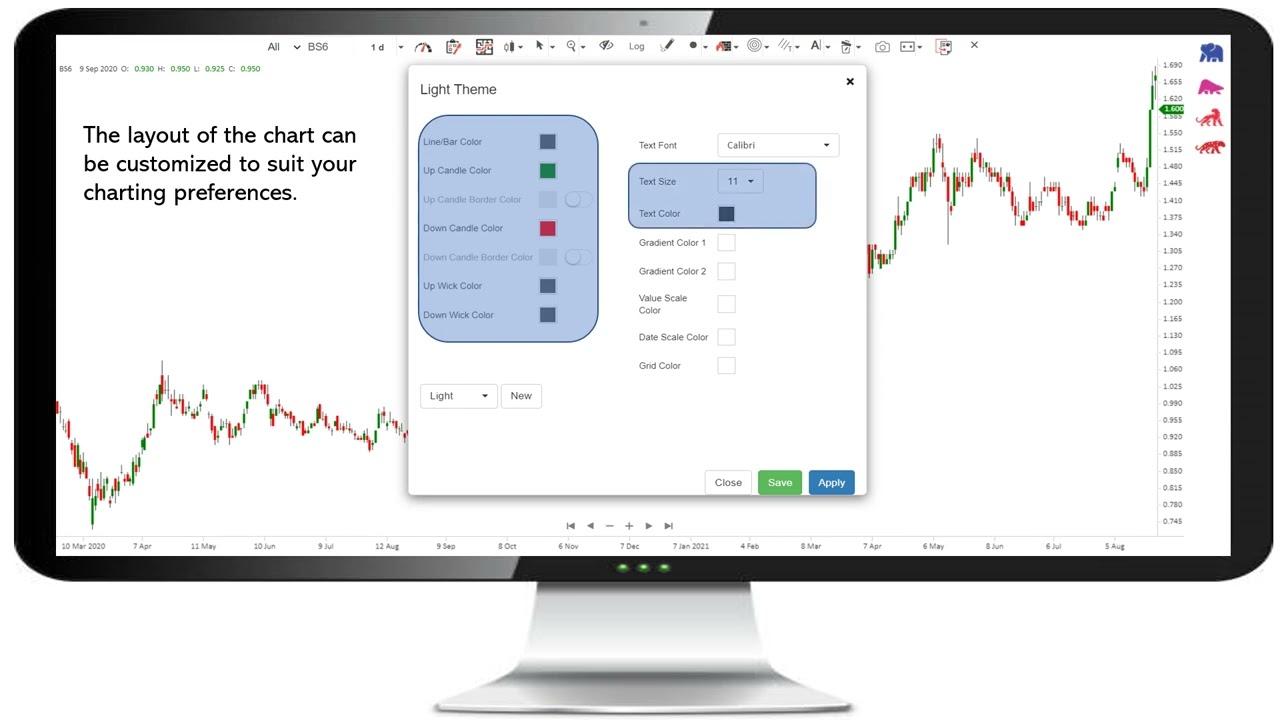
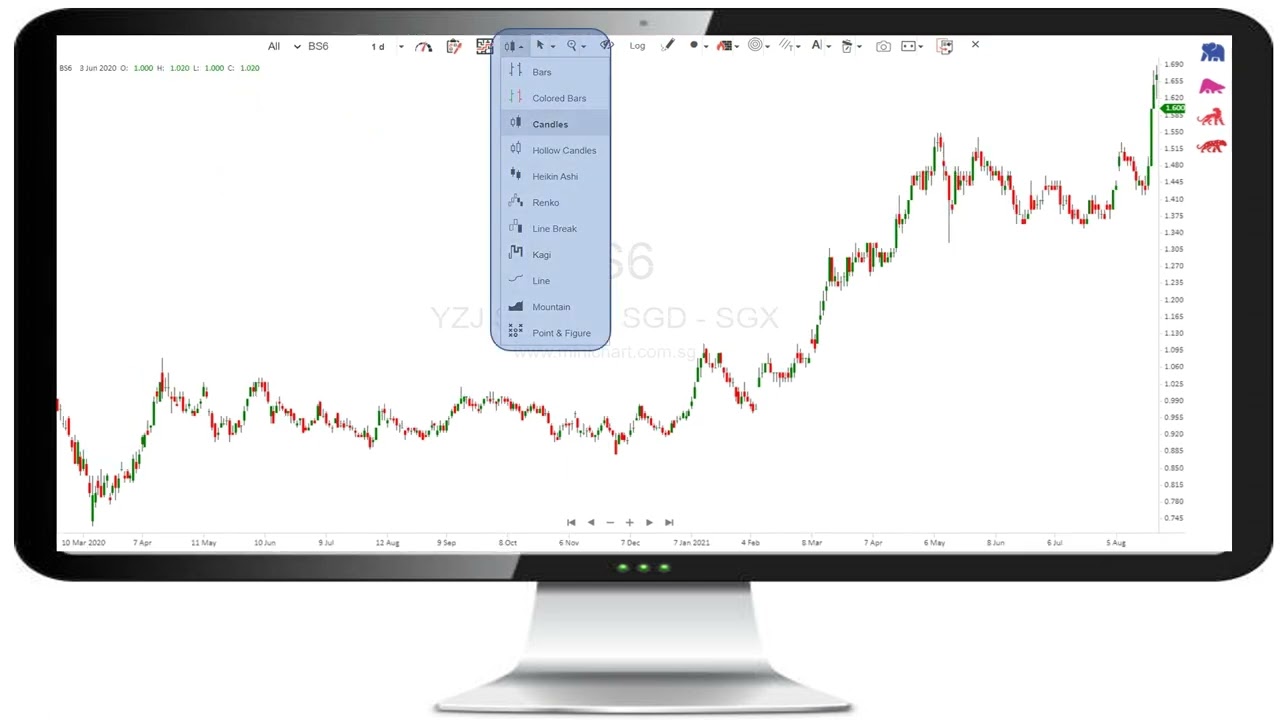
Introduction to Minichart online charting software
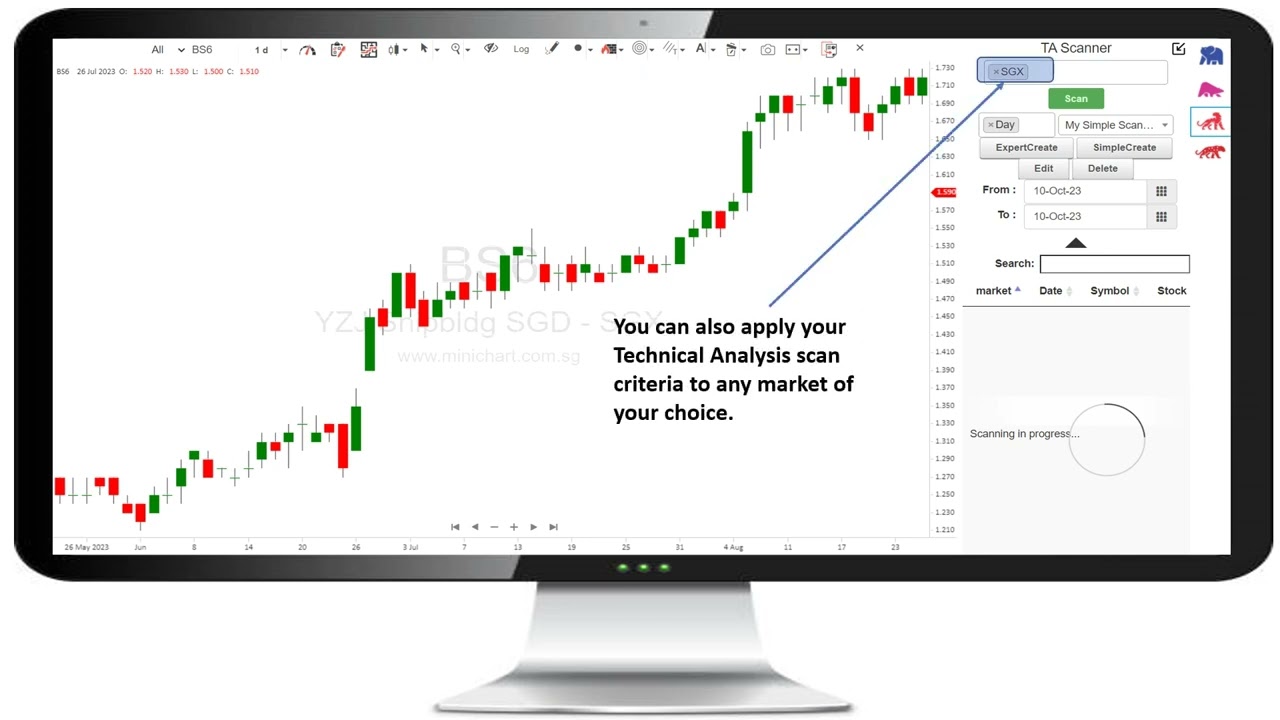
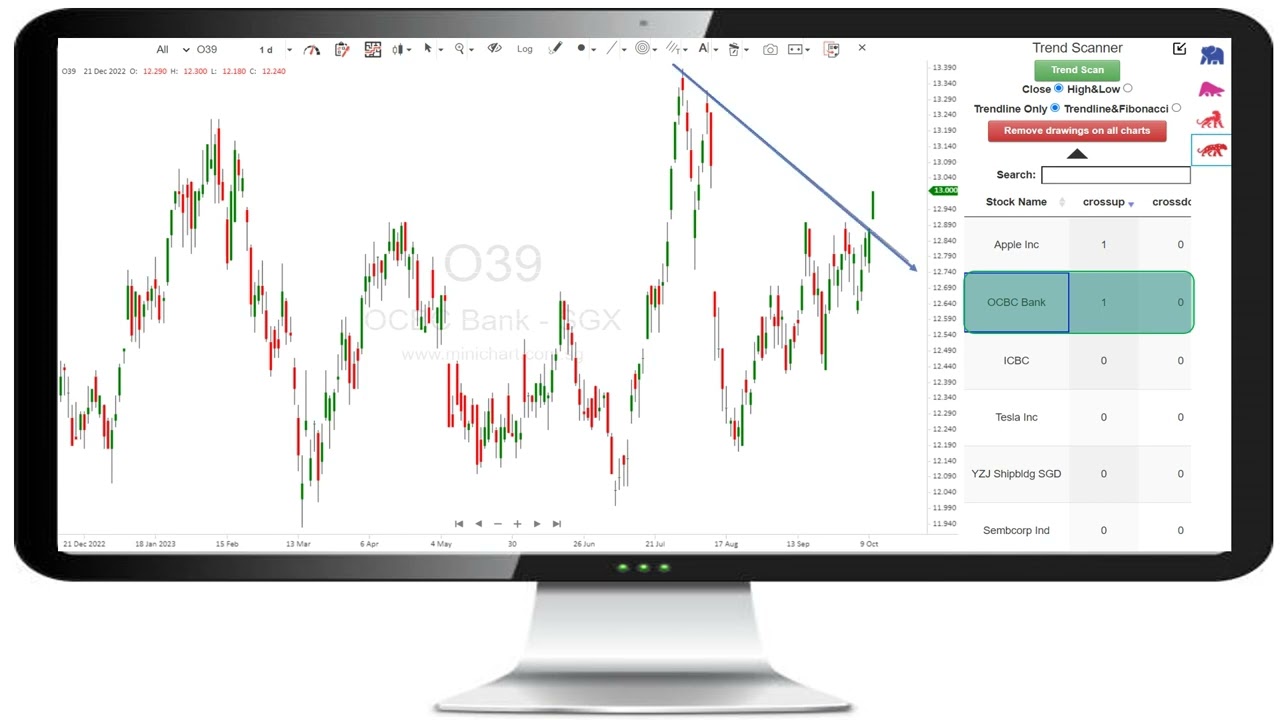
How to use Minichart’s simple scanner?
Related Posts