BrightSpire Capital, Inc. (NYSE: BRSP) Reports Second Quarter 2026 Financial Results
Summary of Key Results
- GAAP Net Loss Attributable to Common Stockholders: (\$18.3) million, or (\$0.15) per share
- Distributable Earnings: \$15.8 million, or \$0.12 per share
- Adjusted Distributable Earnings: \$16.8 million, or \$0.13 per share
- GAAP Net Book Value: \$6.81 per share
- Undepreciated Book Value: \$8.10 per share as of June 30, 2026
- Quarterly Dividend: \$0.16 per share (12.2% annualized yield on current share price)
- Total Loan Portfolio: \$2.9 billion (106 loans), up over 20% year-over-year
- Positive Net Deployment: \$196 million during Q2 2026
- Liquidity: \$131 million available, including \$45 million of unrestricted cash
- Share Repurchases: 3.8 million shares for \$21 million at a blended price of \$5.46 per share
Operational and Strategic Highlights
- BrightSpire Capital continues to focus on expanding its loan portfolio, with \$319 million committed to 10 new senior loans during Q2 2026 and an additional \$295 million closed or in-execution after the quarter end.
- The loan book now stands at approximately \$2.9 billion, representing more than 20% growth compared to the prior year.
- The company is actively working on resolving its remaining Real Estate Owned (REO) properties and redeploying capital to drive further earnings growth.
- Multifamily loans make up 70% of the portfolio, reflecting a strategic focus on this property type.
- The weighted average (W.A.) unlevered all-in yield of the loan portfolio is 7.2%.
- Risk management remains robust, with a W.A. risk ranking of 3.0 and a general CECL reserve of \$100 million, or \$0.79 per share (no specific CECL reserve required this quarter).
- Watch list loans decreased to \$136 million (5% of the portfolio), with three high-risk multifamily loans totaling \$99 million repaid in Q2.
- 6 REO assets total \$330 million; two multifamily REOs (\$62 million) are under contract for sale, and an industrial NNN asset is under sale agreement for \$300 million (with assumption of \$200 million mortgage debt), both expected to close in Q3 2026.
Capitalization and Liquidity
- Strong Liquidity Position: \$131 million in available liquidity, comprised of \$45 million in cash, \$30 million in revolver capacity, and \$56 million in approved but undrawn borrowings.
- Master Repurchase Facility: \$2.35 billion total capacity, with \$1.4 billion of facility availability as of July 24, 2026.
- Debt-to-Equity Ratio: 2.7x; Debt-to-Asset Ratio: 70%
- All-In Cost of Financing: 5.50%
- Capital structure is diversified and primarily non-recourse, mitigating refinancing and liquidity risks.
Shareholder Actions and Potential Share Price Movers
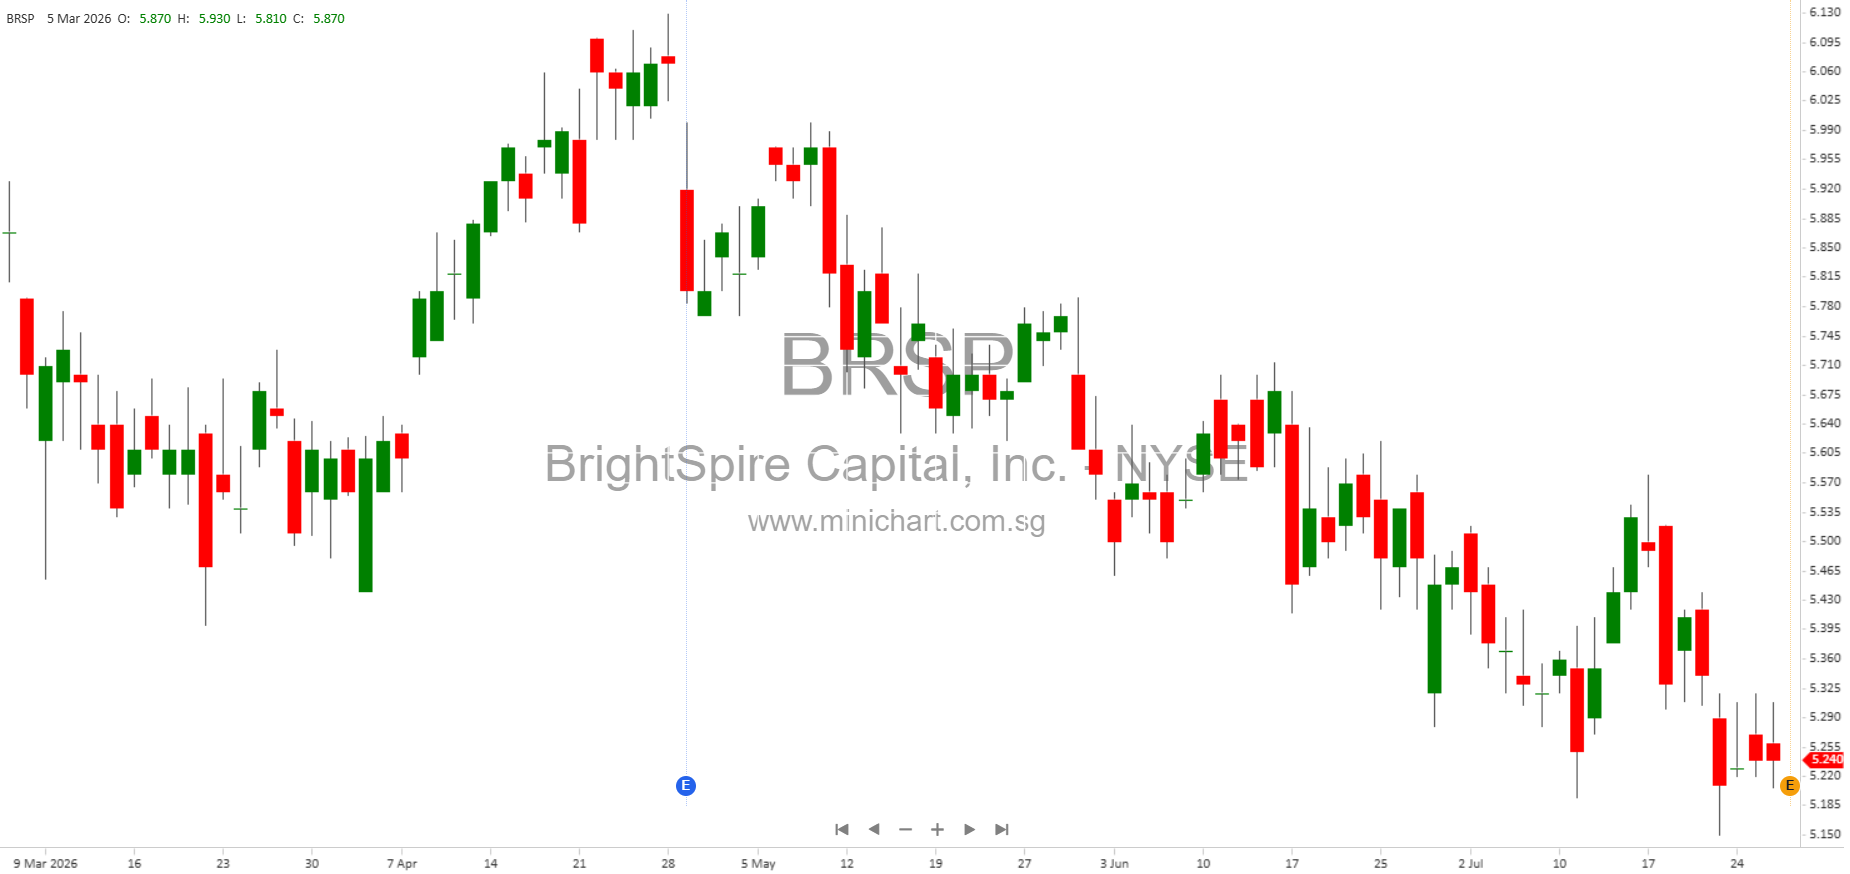
- Significant Share Repurchases: The company repurchased 3.8 million shares (\$21 million, \$5.46 per share), which could support the share price by reducing share count and signaling management’s confidence in intrinsic value.
- Dividend Maintained: The quarterly dividend of \$0.16 per share (12.2% annualized yield) was maintained, indicating continued commitment to shareholder returns.
- Asset Sales Pending: Contracted sales of two multifamily REOs (\$62 million) and an industrial NNN asset (\$300 million, with \$200 million debt assumption) are expected to close in Q3. Realization of these sales could unlock capital for reinvestment, further supporting earnings and book value.
- Loan Portfolio Growth: Over \$614 million in new and in-execution senior loan commitments since the start of Q2 2026, indicating robust origination activity and future earnings potential.
- Risk Reduction: Successful repayment of \$99 million in high-risk loans and a decrease in watch list exposure signal improving credit quality and lower potential future losses.
- Interest Rate Sensitivity: The company’s annual net interest income is modestly sensitive to changes in rates (SOFR up or down by 0.25-0.50%, impact is +/- \$0.01–0.03 per share), underscoring relatively stable earnings even in volatile rate environments.
Conference Call and Investor Information
- The company will host an earnings call on July 29, 2026, at 10:00 a.m. ET / 7:00 a.m. PT. Investors can join via phone or webcast, with replay available until August 5, 2026.
- Supplemental financial disclosures and the full investor presentation are available on the Shareholders section of www.brightspire.com.
Cautions and Forward-Looking Statements
- Management notes that forward-looking statements are subject to a range of risks, including borrower defaults, property value fluctuations, market volatility, availability of liquidity, refinancing risk, regulatory changes, and global macroeconomic uncertainty.
- Investors are cautioned not to place undue reliance on forward-looking statements, and the company undertakes no obligation to update them after this release.
Conclusion: What Investors Should Watch
The Q2 2026 results represent a period of continued portfolio growth, active risk reduction, and solid liquidity for BrightSpire Capital. Importantly, the company’s significant share buyback, maintenance of a high-yield dividend, and the anticipated asset sales in Q3 could be positive catalysts for the share price. The decrease in high-risk loans and robust origination activity point to improving credit quality and earnings momentum. However, ongoing exposure to real estate market volatility, rate changes, and potential asset sale execution risks remain key factors for shareholders to monitor closely.
Disclaimer: This article is for informational purposes only and does not constitute investment advice. All forward-looking statements are subject to market, regulatory, and economic risks. Investors should conduct their own due diligence or consult a financial advisor before making any investment decisions.