Piedmont Realty Trust Reports Strong Q2 2026 Results and Raises Annual Outlook
Key Highlights from Q2 2026 Earnings Release
- Second consecutive increase in annual outlook: Piedmont Realty Trust (NYSE: PDM) has raised its 2026 guidance for the second quarter in a row, reflecting strong leasing momentum and improved operational performance.
- Same Store Net Operating Income (NOI) cash growth of 9%: The company generated substantial same store cash NOI growth, indicating robust demand and improved rental rates across its portfolio.
- Record net effective rent: Piedmont achieved its highest quarterly average net effective rent in history at \$25.56 per square foot, driven by strong leasing activity.
- Leasing momentum: The company executed almost 460,000 square feet of leases in Q2, with cash rental rate growth of 14% and accrual rental rate growth of over 32%. Over 700,000 square feet of leases are either already executed or in the legal stage for Q3.
- Future rental income pipeline: Signed but yet-to-commence leases amount to \$39 million in additional annual cash rents, representing 5.7% of portfolio occupancy. Leases under abatement represent another \$28 million in future annual cash rents.
- Financial results:
- Q2 2026 net loss: \$11.1 million (\$0.09 per diluted share), improved from Q2 2025 net loss of \$16.8 million (\$0.14 per diluted share).
- Core FFO: \$0.38 per diluted share, up from \$0.36 in Q2 2025.
- Adjusted FFO: \$31.0 million for Q2, up from \$16.2 million in Q2 2025.
- Same Store NOI growth: 9% (cash basis) and 2.8% (accrual basis) in Q2.
- Portfolio occupancy: In-service portfolio leased percentage was 88.9% at quarter-end. Out-of-service assets (under redevelopment) reached 82.9% leased, with one asset (222 South Orange Avenue) placed back in service during the quarter.
- Balance Sheet:
- Cash and cash equivalents: \$16.8 million.
- Total real estate assets: \$3.41 billion.
- Net debt to gross assets (excluding cash): 39.8%.
- Weighted average cost of debt: 5.50%.
- No debt maturities until 2028.
- Amended \$325 million unsecured term loan, increasing principal to \$400 million and extending maturity to May 2031.
- Full \$600 million revolving credit facility available.
- Awards and ESG achievements:
- Minneapolis Real Estate Journal recognized Piedmont as “Owner/Landlord of the Year.”
- Multiple projects won local or regional TOBY (The Outstanding Building of the Year) Awards.
- 83% of portfolio ENERGY STAR certified, 72% LEED certified, 67% LEED Gold certified.
2026 Outlook – Revised Guidance (Price Sensitive)
- Net loss: Revised outlook for 2026 net loss is between \$44 million and \$41 million (previous guidance was \$48 million to \$44 million).
- FFO: NAREIT and Core FFO for the year expected between \$190 million and \$197 million, or \$1.50–\$1.55 per diluted share (previous guidance was \$186 million to \$194 million, or \$1.47–\$1.53 per share).
- Key assumptions:
- Leasing volume of 1.7–2.0 million sq ft for the year; year-end leased percentage expected to reach 89.5–90.5% for in-service portfolio.
- Same Store NOI increase of 5–8% (both cash and accrual basis), up by 2% from initial estimate.
- Interest expense (net): \$128–\$130 million.
- General & administrative expense: \$31–\$33 million.
- No speculative acquisitions, dispositions, or refinancing included in guidance.
Potential Share Price Drivers
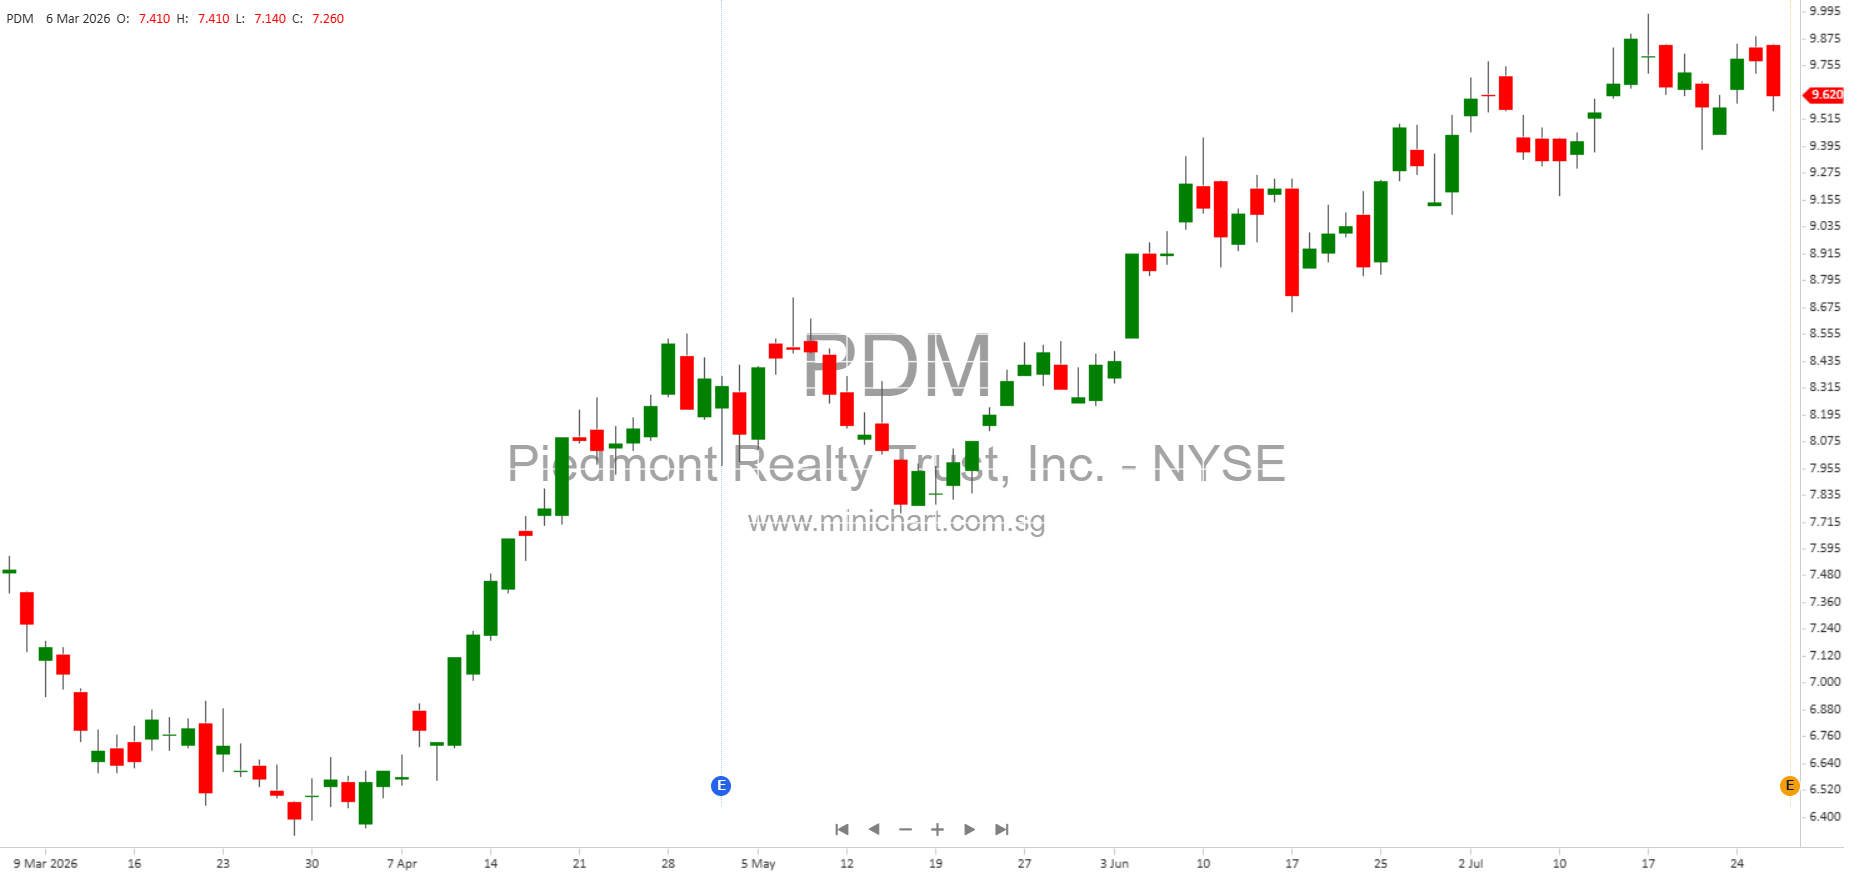
- Raised outlook for earnings and FFO: Two consecutive quarters of improved guidance signal positive momentum and may drive share price appreciation.
- Record net effective rents and strong leasing spreads: Indicates pricing power and demand for Piedmont’s assets, supporting valuation.
- Large pipeline of future contractual income: \$67 million in additional annual rents from executed leases yet to commence or under abatement provides visibility into future growth.
- Solid balance sheet and liquidity: No debt maturities until 2028, improved cost of debt, and full credit facility available reduce refinancing risk.
- Operational and ESG awards: Continued recognition for asset quality and management may enhance brand and tenant attraction.
Risks and Considerations for Shareholders
- Interest expense remains elevated: Recent refinancing in a higher rate environment continues to impact net income.
- Lease expirations and tenant concentration: Some major tenants (e.g., New York City, State of New York, Amazon, US Bancorp, Microsoft) contribute materially to revenues; any changes in their occupancy or financial condition may affect cash flow.
- Uncertainties: Guidance assumes no speculative capital markets activity, and actual results may fluctuate due to lease commencements, expirations, and market events.
- Market risks: Economic, regulatory, geopolitical, and sector-specific risks (including AI, virtual meeting platforms, inflation, supply chain disruptions, and cyber threats) could affect office demand and tenant performance.
Portfolio and Financials – Detailed Metrics
- Portfolio: 29 in-service projects, 15.1 million sq ft, 88.9% leased.
- Q2 leasing: 459,000 sq ft; average lease size 11,000 sq ft; weighted lease term ~8 years.
- Tenant diversification: Top tenants include government, technology, financial services, and legal industries, with diversified credit profiles.
- Industry and geographic diversification: Atlanta, Dallas, Orlando, New York, Northern Virginia, Minneapolis, Boston, and Other markets. Largest exposure to Atlanta (31% of lease revenue).
- Debt maturity schedule: Next maturities begin in 2028; weighted average maturity ~52 months; weighted average interest rate 5.50%.
- Balance sheet: Total assets \$4.05 billion; total debt \$2.25 billion; equity market capitalization \$1.14 billion at period end.
Conclusion
Piedmont Realty Trust’s Q2 2026 results reflect strong operational performance, successful leasing, and robust future rental income pipeline. The improved guidance and continued asset quality recognition are likely to be viewed positively by investors and may drive share price appreciation. However, shareholders should remain mindful of ongoing market risks, tenant concentration, and elevated interest expense, which may temper near-term earnings.
Conference Call Details
Management will host a conference call and webcast on July 29, 2026, at 9:00 AM Eastern Time to discuss these results and answer questions.
Disclaimer: This article is for informational purposes only and does not constitute investment advice. Actual results may differ materially from forward-looking statements due to various risks and uncertainties. Investors should review all relevant filings and consult their financial advisors before making investment decisions.