Franklin Street Properties Corp. Reports Second Quarter 2026 Results
Key Highlights and Strategic Developments
- Expanded Strategic Review Process: FSP has formally launched an expanded strategic review, engaging BofA Securities and JLL Real Estate Investment Banking as co-financial advisors. This process aims to explore a wide range of potential strategic opportunities, including corporate transactions, portfolio-level deals, individual asset sales, and other initiatives focused on maximizing shareholder value.
- Debt Refinancing: The company recently refinanced its outstanding debt, significantly improving financial flexibility. This allows FSP to avoid rushed decisions and pursue strategic actions in a more disciplined manner, positioning the company to act opportunistically as market conditions evolve.
Major Transactions and Portfolio Updates
- Greenwood Plaza Property Sale: Subsequent to Q2, on July 8, 2026, FSP sold its Greenwood Plaza property in Englewood, Colorado to the University of Colorado Health for approximately \$19.4 million. Around \$8.5 million of the net proceeds was used to repay debt, including interest and fees, while \$8.9 million was retained as cash. This sale highlights the company’s ability to execute targeted owner-user marketing and reflects ongoing progress in meeting strategic objectives.
- Portfolio Composition: As of June 30, 2026, FSP directly owned 14 properties totaling about 4.8 million square feet, with a leased percentage of 67.4%. This marks a decrease from 68.9% at year-end 2025, primarily due to lease expirations outpacing new leases signed in the first half of 2026.
- Geographic Focus: The portfolio is concentrated in the Sunbelt and Mountain West regions, with significant investments in Colorado, Texas, and Minnesota.
Financial Performance
- GAAP Net Loss: FSP reported a GAAP net loss of \$16.6 million (\$0.16 per share) for Q2 2026, and \$26.1 million (\$0.25 per share) for the six months ended June 30, 2026.
- Funds From Operations (FFO): FFO was \$1.6 million (\$0.02 per share) for Q2 and \$2.7 million (\$0.03 per share) for the first half of 2026.
- General & Administrative Expense Reduction: G&A expenses were \$1.7 million lower for the six months ended June 30, 2026 compared to the prior year period, reflecting effective cost management through lower personnel costs.
- Cash and Liquidity: As of June 30, 2026, FSP had \$22.5 million in cash, cash equivalents, and restricted cash, down from \$30.6 million at the end of 2025.
- Debt Profile: The balance sheet shows initial term loans of \$253.1 million as of June 30, 2026, with prior term loans and senior notes retired as part of the refinancing.
Operational Updates
- Leasing Activity: In the first half of 2026, FSP leased approximately 170,000 square feet, including about 120,000 square feet of renewals and expansions. The weighted average GAAP base rent for leases signed was \$34.34 per square foot, a 7.4% increase over the 2025 average. The average lease term on new leases signed was 6.3 years, up from 5.7 years in 2025.
- Occupancy Trends: The overall portfolio weighted average rent per occupied square foot was \$30.79 as of June 30, 2026, nearly flat from \$30.86 at year-end 2025.
Dividend Policy
- Dividend Suspension: On March 9, 2026, the Board of Directors suspended quarterly dividend payments to preserve cash and redeploy capital into leasing efforts aimed at enhancing portfolio value. The suspension is estimated to preserve \$4.1 million in cash on an annualized basis. The Board will reassess the policy quarterly.
Market Outlook and Management Commentary
- Office Market Stabilization: Management notes incremental signs of stabilization in the national office investment market, including improved leasing activity, a decline in new office construction, and a modest recovery in investment sales activity. However, capital markets remain selective and transaction activity is still below historical averages.
- Strategic Focus: The company remains focused on improving occupancy, extending lease duration, managing operating expenses, and allocating capital for long-term value creation. The expanded strategic review and active leasing efforts are considered the best path to maximizing value for shareholders.
Other Noteworthy Items
- Consolidation of Sponsored REIT: As of January 1, 2023, FSP consolidated operations of its Monument Circle sponsored REIT. The property was sold in June 2025, and the entity was dissolved in December 2025.
- Largest Tenants: The top 20 tenants occupy 32.7% of portfolio square footage. The largest tenant is CITGO Petroleum Corporation (5.2% of portfolio), followed by EOG Resources, Inc. (3.5%), and the US Government (3.5%).
Risks and Forward-Looking Statements
- Management cautions that forward-looking statements are subject to risks and uncertainties, including economic conditions, market demand, inflation, interest rates, energy prices, regulatory changes, and other factors that could impact actual results.
- Recent and potential future property dispositions, debt refinancing, and ongoing strategic review may materially affect future performance and shareholder value.
Conclusion
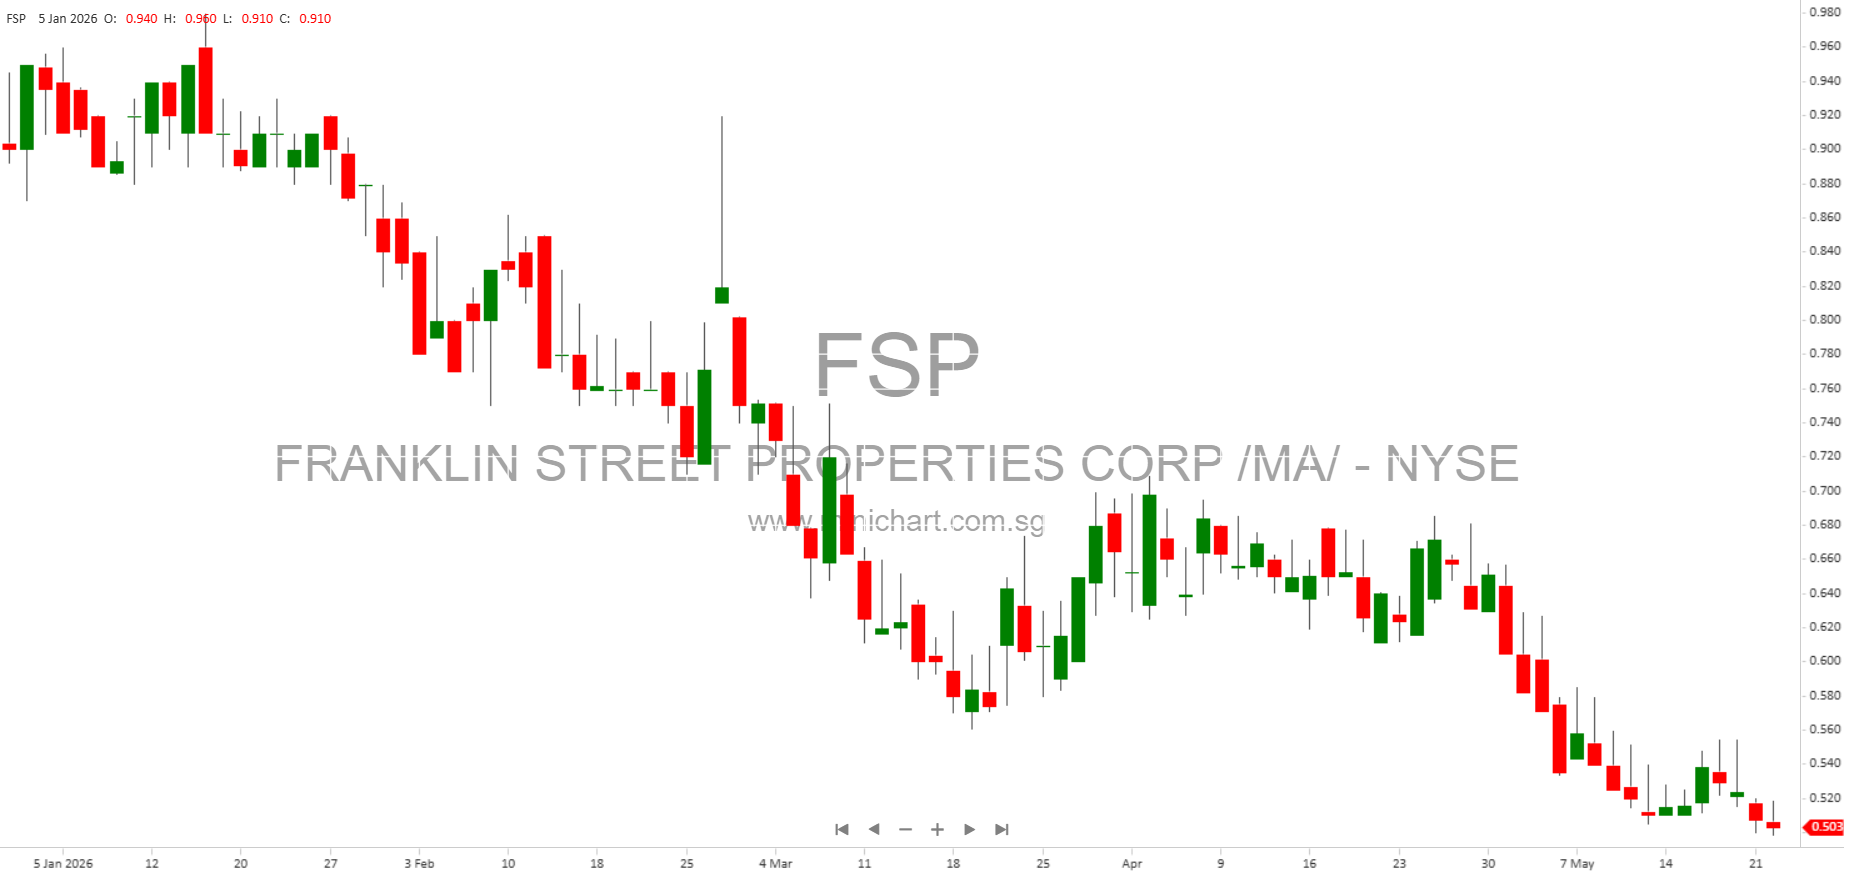
Franklin Street Properties Corp. is actively pursuing a broad range of strategic alternatives to maximize shareholder value, supported by a formal strategic review process, recent debt refinancing, and targeted asset sales. The suspension of dividends, significant cost reductions, and a focus on leasing and portfolio management signal a disciplined approach in a challenging office market environment. Investors should closely monitor further developments from the ongoing strategic review and any announcements related to corporate or portfolio transactions, which could materially impact share value.
Disclaimer: This article is for informational purposes only and does not constitute investment advice. Investors should review official filings and consult with a qualified financial advisor before making investment decisions. Forward-looking statements are subject to risks and uncertainties that could cause actual results to differ materially from those anticipated.