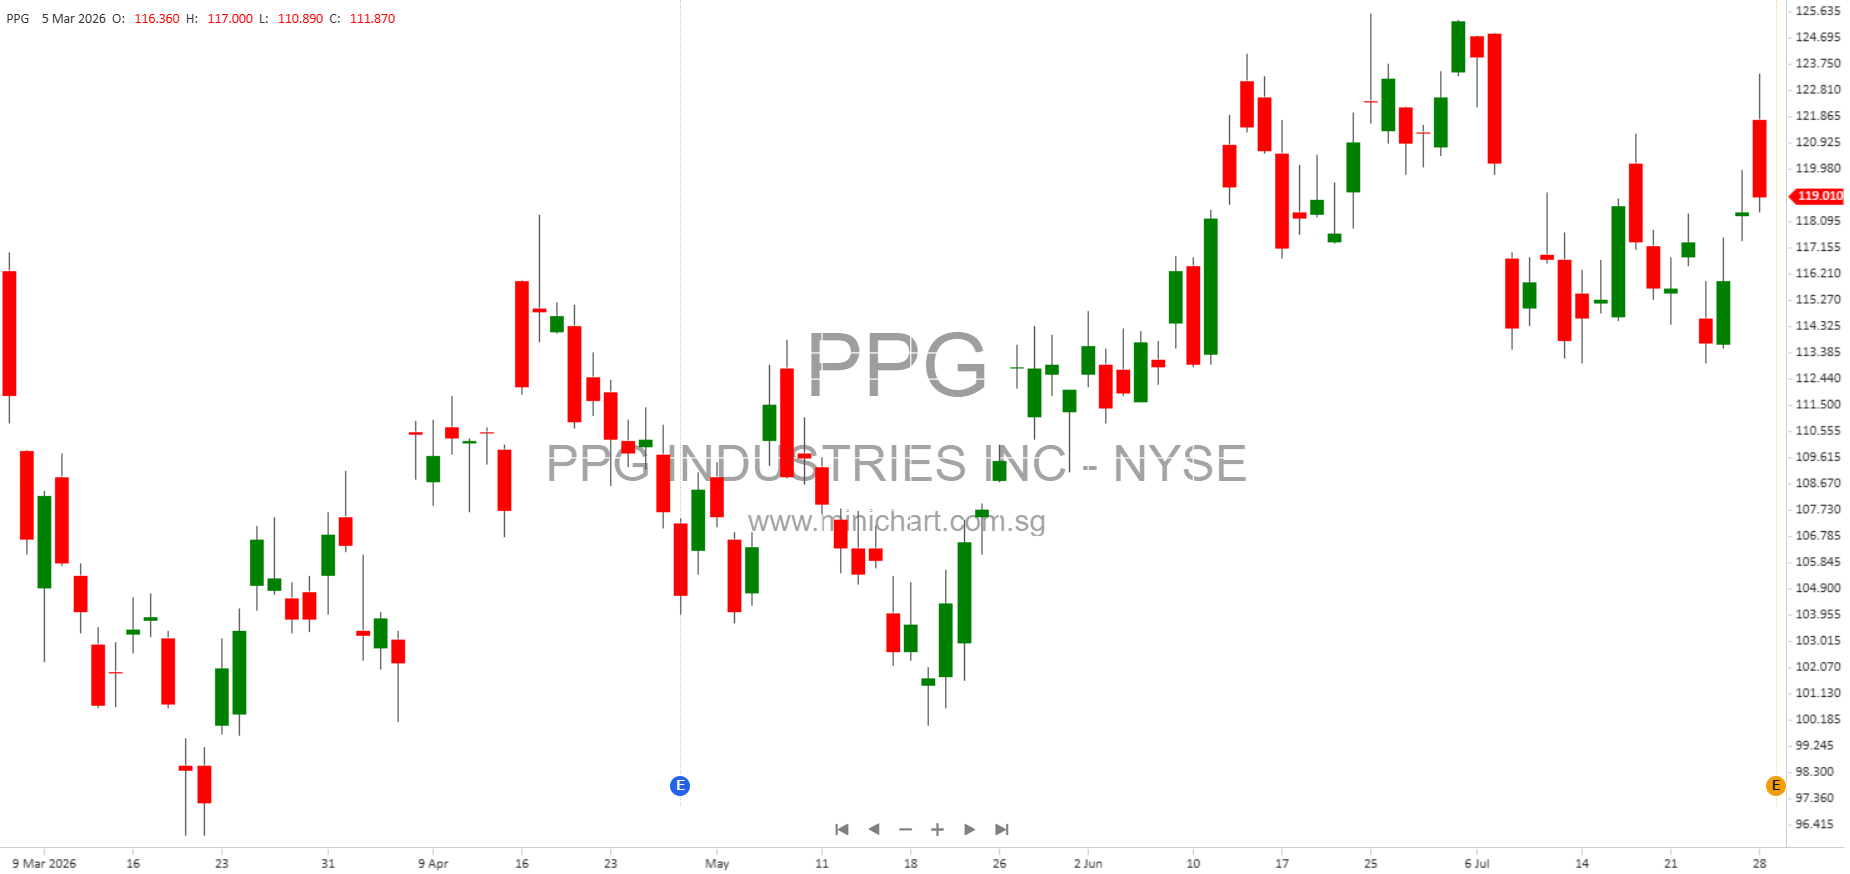
PPG Industries Reports Q2 2026 Earnings: Robust Sales Growth, Solid Guidance, and Strategic Pricing
Key Financial Highlights
- Net Sales: \$4.5 billion, up 7% year-over-year (YOY).
- Organic Sales Growth: 4% YOY, with growth in 8 out of 9 business units.
- Sales Volumes: Increased 2% YOY.
- Selling Prices: Up 2% YOY, reflecting strategic pricing actions.
- Reported EPS: \$1.96, Adjusted EPS: \$2.23 (slightly up from \$2.22 YOY).
- Net Income: \$439 million (down 2% YOY); Adjusted Net Income: \$500 million (down 1% YOY).
- Cash Flow from Operating Activities: Approximately \$600 million year to date, over \$220 million higher YOY.
- Share Repurchases: \$75 million in Q2, \$175 million year-to-date.
- Full-Year 2026 Adjusted EPS Guidance: Reaffirmed at \$7.70 to \$8.10.
CEO Commentary and Strategic Insights
Chairman and CEO Tim Knavish emphasized PPG’s sixth consecutive quarter of organic sales growth, outpacing the industry by 300 basis points. Growth was broad-based, with strong contributions from the differentiated aerospace business and architectural coatings in Latin America. This reflects PPG’s ability to accelerate momentum even in a complex macro environment.
Key segment updates include:
- Global Architectural Coatings: 2% organic sales growth, 100 basis points EBITDA margin improvement, led by Latin America. Margin expansion is attributed to high-performance products, strong brand recognition, and cost controls.
- Performance Coatings: 3% organic sales growth, strong demand in aerospace, protective, and marine coatings; however, margin pressure due to weaker automotive refinish demand. Automotive refinish expected to recover in H2 2026.
- Industrial Coatings: 5% sales volume growth, with share gains in packaging (+double digits), automotive OEM, and industrial coatings (both mid-single digits). Price realization was flat, but new price actions have been executed.
Strategic Pricing and Cost Management
PPG has proactively increased prices across all businesses, resulting in a 2% selling price improvement. Costs for raw materials, energy, logistics, and packaging have increased, but PPG covered about 90% of cost inflation in Q2 and expects to fully offset inflation by Q4 2026 — one quarter ahead of plan. This accelerated realization is a positive surprise and may support margins going forward.
Segment-Specific Performance
Global Architectural Coatings
- Net Sales: \$1.1 billion (+8% YOY)
- Segment Income: \$185 million (+16% YOY)
- Segment EBITDA Margin: 19.4% (+100 bps YOY)
- Drivers: Foreign currency tailwind (+6%), price increases (+3%), offset by slight volume decline (-1%). Latin America and Asia Pacific performed well, especially Mexico.
- Outlook: Q3 organic sales expected to be flat to up low single-digits; EBITDA margin to remain flat.
Performance Coatings
- Net Sales: \$1.62 billion (+7% YOY)
- Segment Income: \$329 million (-8% YOY)
- Segment EBITDA Margin: 22.7% (-300 bps YOY)
- Drivers: Aerospace and protective/marine coatings led growth; automotive refinish volumes declined double digits. Order backlog in aerospace remained near \$300 million.
- Outlook: Q3 organic sales growth mid- to high-single digits YOY; H2 2026 should see margin expansion as pricing and refinish stabilize.
Industrial Coatings
- Net Sales: \$1.78 billion (+7% YOY)
- Segment Income: \$229 million (+1% YOY)
- Segment EBITDA Margin: 15.9% (-70 bps YOY)
- Drivers: Volume growth in all businesses, strong share gains in packaging (+20% over two years). Automotive OEM outperformed global auto production by 500 bps. Pricing was flat following declines earlier in the cycle.
- Outlook: Q3 organic sales flat to low single-digit growth. H2 2026 may see margin compression due to index-based pricing impacts.
Balance Sheet & Capital Allocation
- Cash & Short-Term Investments: \$1.6 billion at quarter end.
- Net Debt: \$5.3 billion, down \$415 million YOY.
- Bond Issuance: CHF320 million in long-term bonds (2030/2034), at attractive rates (1.22% and 1.66%).
- Share buybacks: \$175 million year-to-date — ongoing capital return to shareholders.
- Dividend Payments: \$317 million in the first half of 2026.
- Capital Expenditures: \$309 million YTD.
Outlook and Guidance
- Q3 organic sales growth projected at low to mid-single-digit range.
- Adjusted EBITDA margin is expected to be flat to down 100 bps YOY in Q3.
- Full-year 2026 adjusted EPS guidance reaffirmed at \$7.70 to \$8.10.
- Management expects continued share gains, pricing realization, and execution of self-help actions to drive results.
Other Noteworthy Items for Shareholders
- Price Sensitivity: The company’s ability to offset cost inflation faster than planned and maintain robust guidance, despite cost headwinds, is positive and could support share price.
- Segment Mix: Aerospace and packaging coatings were standouts. Automotive refinish is a weak spot but expected to improve H2 2026.
- Capital Structure: Lower net debt and ongoing buybacks signal strong capital discipline and confidence in future cash flows.
- Risks: Management notes ongoing macro, cost, and volume uncertainties, including potential headwinds from raw materials, energy, labor, logistics, and global economic and geopolitical factors.
Conclusion
PPG’s Q2 2026 report demonstrates continued sales momentum, effective cost and pricing management, and strategic focus on high-growth segments. The reaffirmed full-year guidance and faster-than-expected inflation coverage are both price-sensitive positives. Investors should monitor the recovery in automotive refinish, the execution of additional price increases, and any shifts in global demand or input costs that could affect margins or sales volumes.
Disclaimer: This article is for informational purposes only and does not constitute investment advice. Investors should consult their own advisors and review all company filings and earnings materials before making investment decisions. Forward-looking statements involve risks and uncertainties as detailed in company SEC filings.