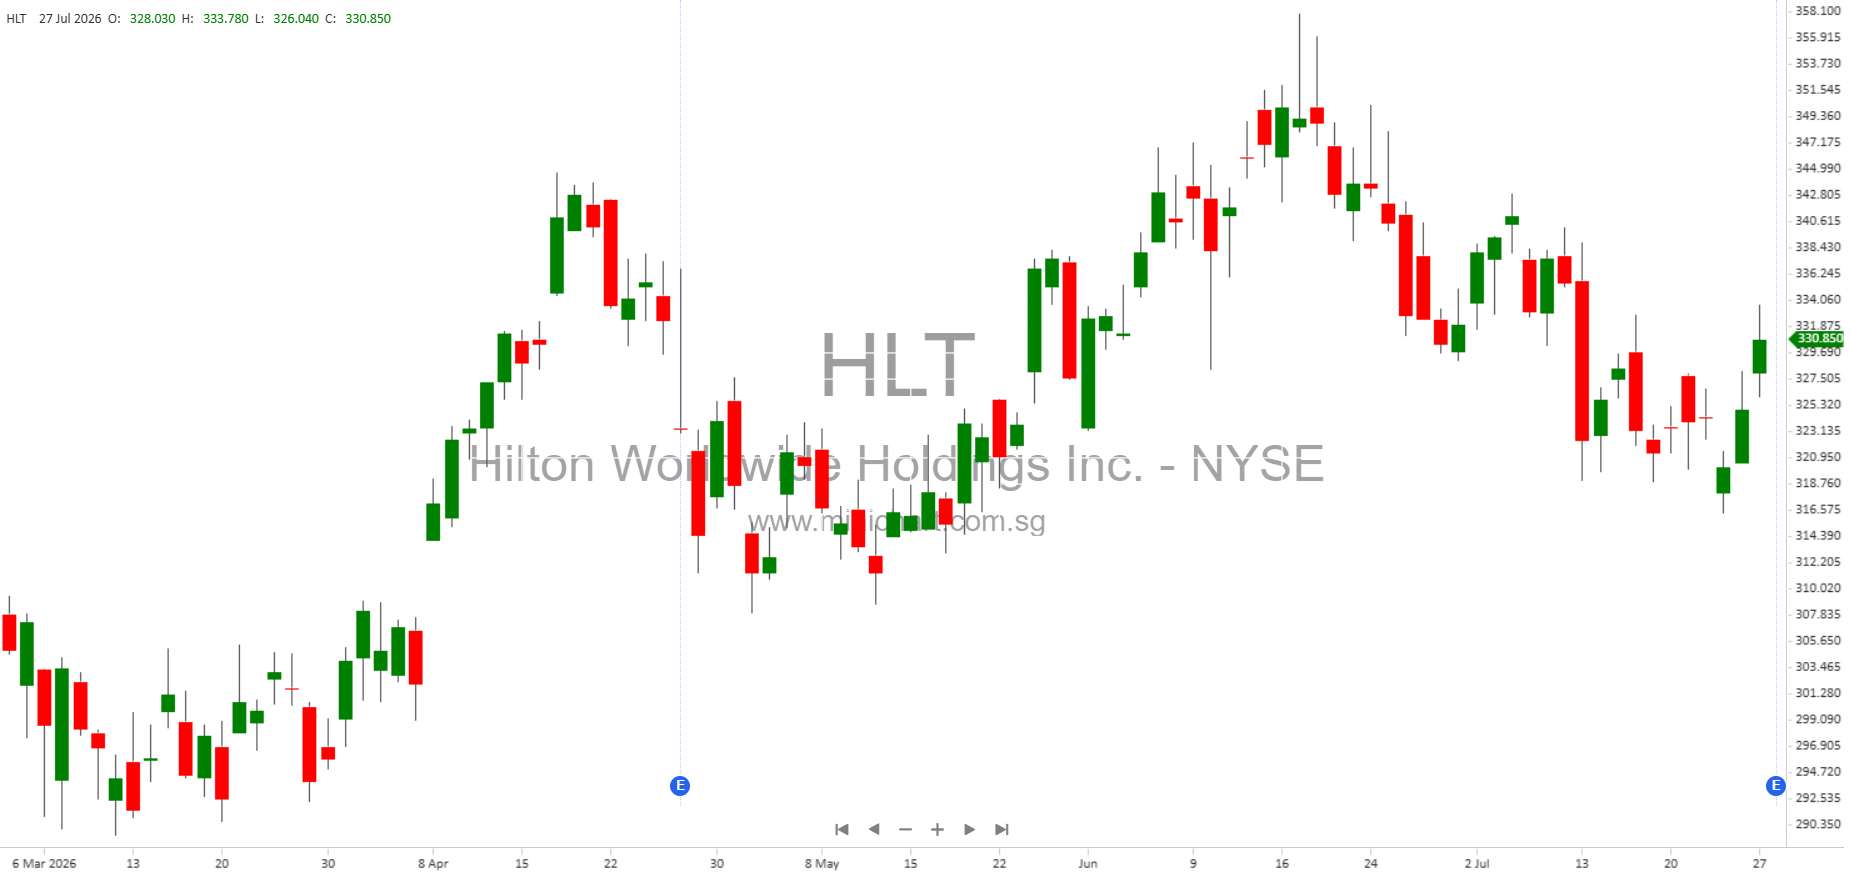
Hilton Worldwide Holdings Inc. Q2 2026 Financial Report: Key Highlights for Investors
Executive Summary
Hilton Worldwide Holdings Inc. has released its unaudited financial results for the quarter and six months ended June 30, 2026. The report details robust revenue growth, strong earnings, significant cash generation, and continued shareholder returns via dividends. Investors should pay close attention to trends in profitability, capital allocation, and any movements in key financial metrics that could impact share value.
Key Financial Highlights
- Revenues: Hilton reported total revenues of \$2,764 million for the three months ended June 30, 2026, marking an increase from \$2,525 million in the same period last year. For the six-month period, revenues were \$5,326 million, up from \$4,987 million in the first half of 2025.
- Net Income: Net income attributable to Hilton stockholders was \$482 million for Q2 2026, up from \$440 million in Q2 2025. For the first six months, net income reached \$867 million, compared to \$740 million for the same period last year.
-
Earnings Per Share (EPS):
- Basic EPS: \$2.10 (Q2 2026), \$1.85 (Q2 2025)
- Diluted EPS: \$2.10 (Q2 2026), \$1.84 (Q2 2025)
- Six Months Ended: Basic EPS \$3.80 (2026) vs \$3.10 (2025); Diluted EPS \$3.76 (2026) vs \$3.07 (2025)
- Operating Income: Operating income for Q2 2026 was \$858 million (up from \$773 million in Q2 2025). For the first half, operating income was \$1,536 million (up from \$1,314 million in 2025).
- Cash and Cash Equivalents: Hilton ended the quarter with \$1,009 million in cash and cash equivalents, an improvement from \$918 million at the end of last year.
- Stockholders’ Equity (Deficit): As of June 30, 2026, Hilton reported a stockholders’ deficit of \$6,303 million, compared to a deficit of \$5,388 million at the end of 2025. This negative equity is largely due to significant treasury stock repurchases.
- Dividends: The company declared a cash dividend of \$0.15 per share for Q2 2026, consistent with the prior year. \$0.30 per share was declared for the half-year period.
Shareholder Returns and Capital Allocation
- Treasury Stock Repurchases: Hilton continues to be aggressive in returning capital to shareholders, as evidenced by a treasury stock value of \$14,428 million as of June 30, 2026, up from \$12,247 million at year-end 2025. This ongoing buyback is a major driver of the company’s negative equity and is likely to be price sensitive as it reflects management’s confidence in the business and supports the share price.
- Dividends Paid: Consistent dividend payouts reinforce Hilton’s commitment to returning value to shareholders.
Balance Sheet and Liquidity
- Total Assets: \$16,774 million as of June 30, 2026 (flat versus year-end 2025)
- Liabilities: Remain stable, with no indications of significant adverse changes or defaults upon senior securities.
- Redeemable Noncontrolling Interests: Slight decrease to \$5 million in Q2 2026 from \$13 million at year-end 2025.
Cash Flow and Operations
- Net Cash Provided by Operating Activities: \$1,110 million for the first half of 2026 (up from \$1,003 million in 2025), indicating strong operational performance and cash generation.
- Capital Expenditures: Capital expenditures for property and equipment remain disciplined, supporting ongoing asset-light strategy.
Other Noteworthy Items
- Stock Outstanding: Shares outstanding decreased from 230,433,192 at December 31, 2025 to 225,696,464 as of June 30, 2026, reflecting continued share repurchases.
- Comprehensive Income: Comprehensive income for Hilton stockholders was \$849 million for the first six months of 2026, higher than \$817 million in the prior year, despite foreign currency and pension adjustments.
- No Defaults or Unregistered Sales: No defaults upon senior securities or unregistered sales of equity securities were reported, indicating financial stability and good governance.
Potential Price-Sensitive Information
- Strong Earnings Growth: The increase in net income, EPS, and operating income may positively influence investor sentiment and share price.
- Share Buybacks: Continued aggressive buybacks reduce share count, support EPS growth, and are generally considered share price supportive.
- Stable Dividend Policy: The continuation of dividends maintains income for investors and signals confidence in future cash flows.
- Negative Equity: While largely due to buybacks, the ongoing stockholders’ deficit is a metric investors should monitor as it may affect credit ratings and capital structure perceptions.
Risks and Considerations
- Stockholders’ Deficit: The large and growing negative equity position, although driven by buybacks, warrants ongoing monitoring by investors for any implications on the company’s financial flexibility.
- Currency and Pension Adjustments: Comprehensive income remains exposed to foreign currency and pension plan adjustments, which could impact reported earnings in volatile markets.
Conclusion
Hilton Worldwide Holdings Inc.’s Q2 2026 results highlight strong operational and financial performance, ongoing shareholder returns via dividends and buybacks, and prudent capital allocation. The company’s strategy of returning capital to shareholders, combined with solid earnings growth, is likely to be viewed positively by the market. However, investors should remain aware of the company’s negative equity position and exposures to currency and pension adjustments.
Disclaimer: This article is for informational purposes only and does not constitute investment advice. Readers should conduct their own research or consult with a qualified financial advisor before making any investment decisions. Financial data is based on Hilton Worldwide Holdings Inc.’s unaudited Q2 2026 report and is subject to change.