Valmont Industries, Inc. Reports Q2 2026 Financial Results: Key Insights for Investors
Highlights from the Quarterly Report Ended June 27, 2026
- Ticker Symbol: VMI
- Exchange: New York Stock Exchange
- Shares Outstanding as of July 24, 2026: 19,304,858
- Filing Status: Large Accelerated Filer
- Quarterly Period Ended: June 27, 2026
Key Financial Results
Net Sales and Profitability
- Net Sales (Q2 2026): \$1,118,689,000 (rounded)
- Net Sales (Q2 2025): \$1,043,884,000 (rounded)
- Gross Profit (Q2 2026): \$340,817,000
- Gross Profit (Q2 2025): \$321,167,000
- Operating Income (Q2 2026): \$157,590,000
- Operating Income (Q2 2025): \$29,008,000
- Operating Margin (Q2 2026): ~14%
- Operating Margin (Q2 2025): ~2.8%
Significant Items Affecting Comparisons
- Impairment of Long-Lived Assets: There were no impairment charges in Q2 2026, whereas Q2 2025 included a significant impairment charge of \$91,337,000. This absence of impairment in the current quarter contributed to the higher operating income and margin year-over-year.
- Restructuring Charges: Both quarters included \$8,884,000 in restructuring charges.
Other Income and Expenses
- Interest Expense (Q2 2026): \$20,658,000
- Interest Income (Q2 2026): \$1,271,000
- Unrealized Gain on Debt and Equity Securities (Q2 2026): \$3,786,000
- Other, net (Q2 2026): \$737,000
- Nonoperating Expense (Q2 2026): \$14,123,000
Earnings Before Income Taxes
- Q2 2026: \$162,475,000
- Q2 2025: \$19,010,000
Shareholder/Investor Information
- All reports required by Section 13 or 15(d) of the Securities Exchange Act of 1934 have been filed.
- All Interactive Data Files required under Rule 405 of Regulation S-T have been submitted electronically.
- Valmont Industries is neither a shell company nor an emerging growth company.
- There were no events of default on senior securities or unregistered sales of equity securities in the period.
Key Takeaways and Price-Sensitive Insights
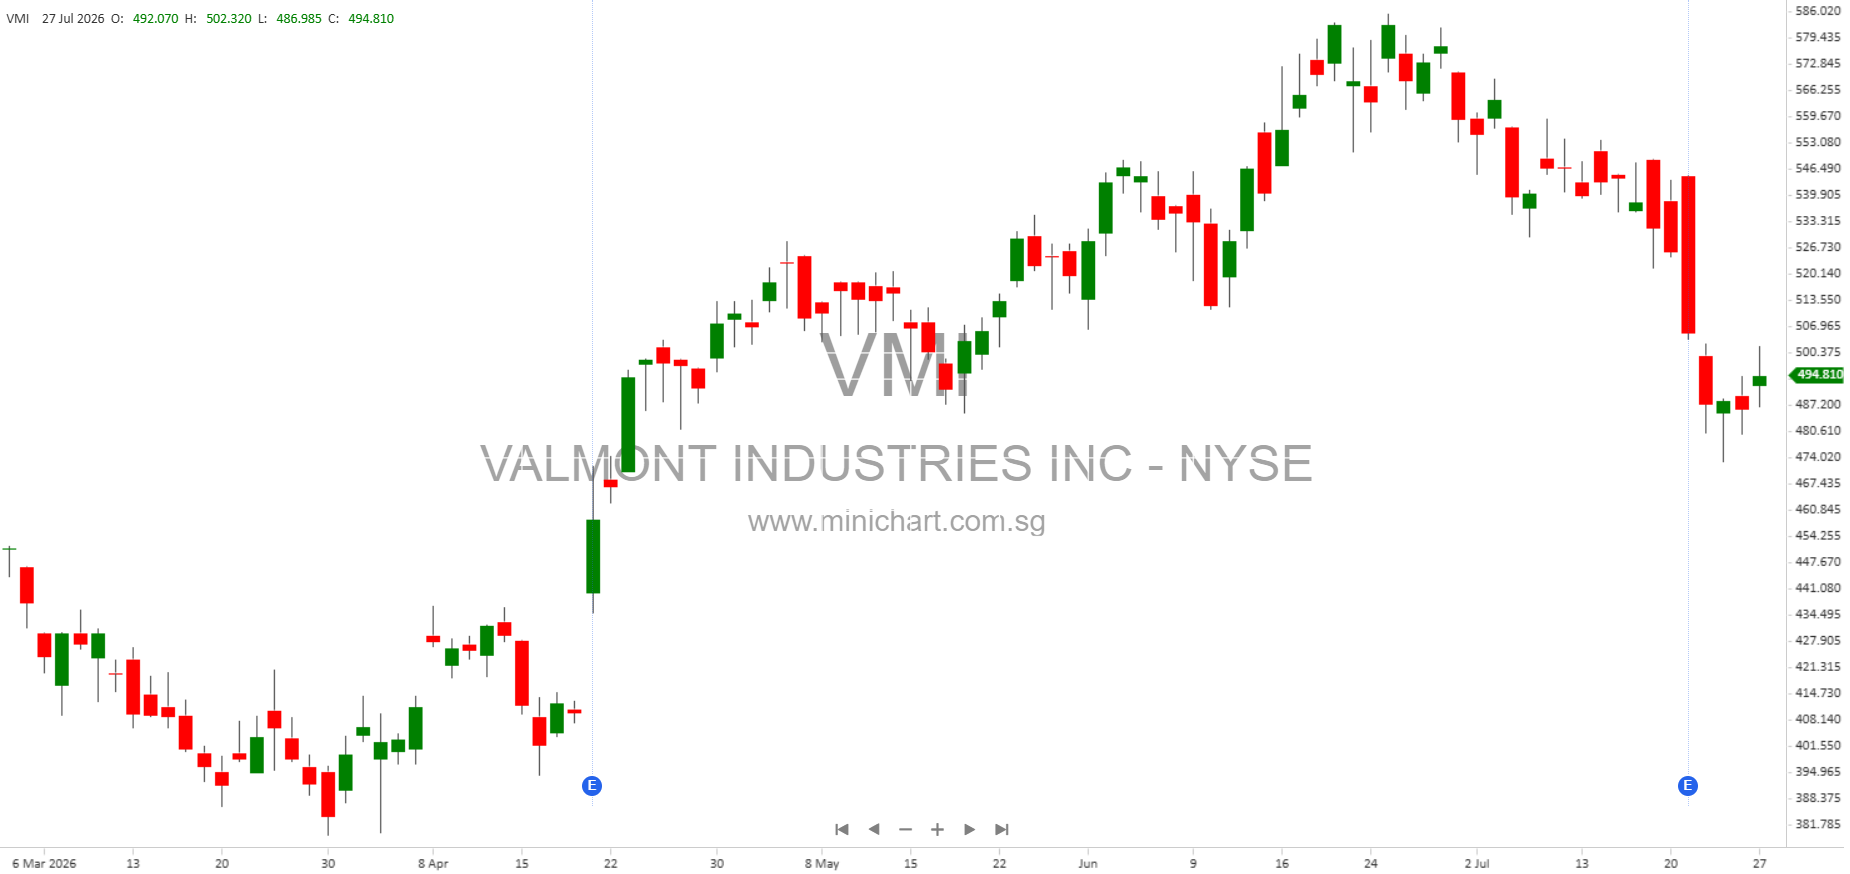
- Substantial Year-Over-Year Improvement: The company reported a dramatic increase in operating income and margin for Q2 2026, primarily due to the absence of significant impairment charges that weighed on Q2 2025 results. This improvement signals a stronger underlying business performance and could be a positive catalyst for the share price.
- Stable Share Base: Shares outstanding remain stable, with 19.3 million shares as of July 24, 2026, supporting a predictable per-share earnings calculation.
- Continued Restructuring Efforts: Ongoing restructuring charges suggest the company is still working on optimizing operations, but the lack of new large impairments is favorable.
- Consistent Filing and Compliance: The company remains current in its filings and submissions, indicating solid governance and regulatory compliance.
Potential Share Price Implications
- Positive: The sharp rebound in profitability, particularly the swing in operating income from \$29 million to \$157 million, is likely to be viewed very favorably by the market. The absence of new impairments removes a major overhang from last year, while steady revenues and gross profits indicate operational resilience.
- Caution: Investors should note that the improvement is partly the result of a non-recurring item (impairment), so future quarters should be assessed for ongoing earnings power excluding such items.
Conclusion
Valmont Industries, Inc. has delivered a strong Q2 2026, with a massive increase in operating income and improved margins thanks to the absence of impairment charges that affected the prior year. Restructuring charges continue, but at a consistent level. The company remains in strong regulatory standing and maintains a steady share count. These results, particularly the operating income surge, are potentially price-sensitive and may positively impact the share value, as they suggest both a return to normalized profitability and effective management action.
Disclaimer: This summary is based on the company’s quarterly SEC filing for the period ended June 27, 2026. It is not investment advice. Investors should consult the full filing and their financial advisor before making any investment decisions. Past performance is not indicative of future results.