S&P Global Inc. Delivers Strong Q2 2026 Results: Double-Digit Revenue Growth, AI Expansion, and Share Buybacks
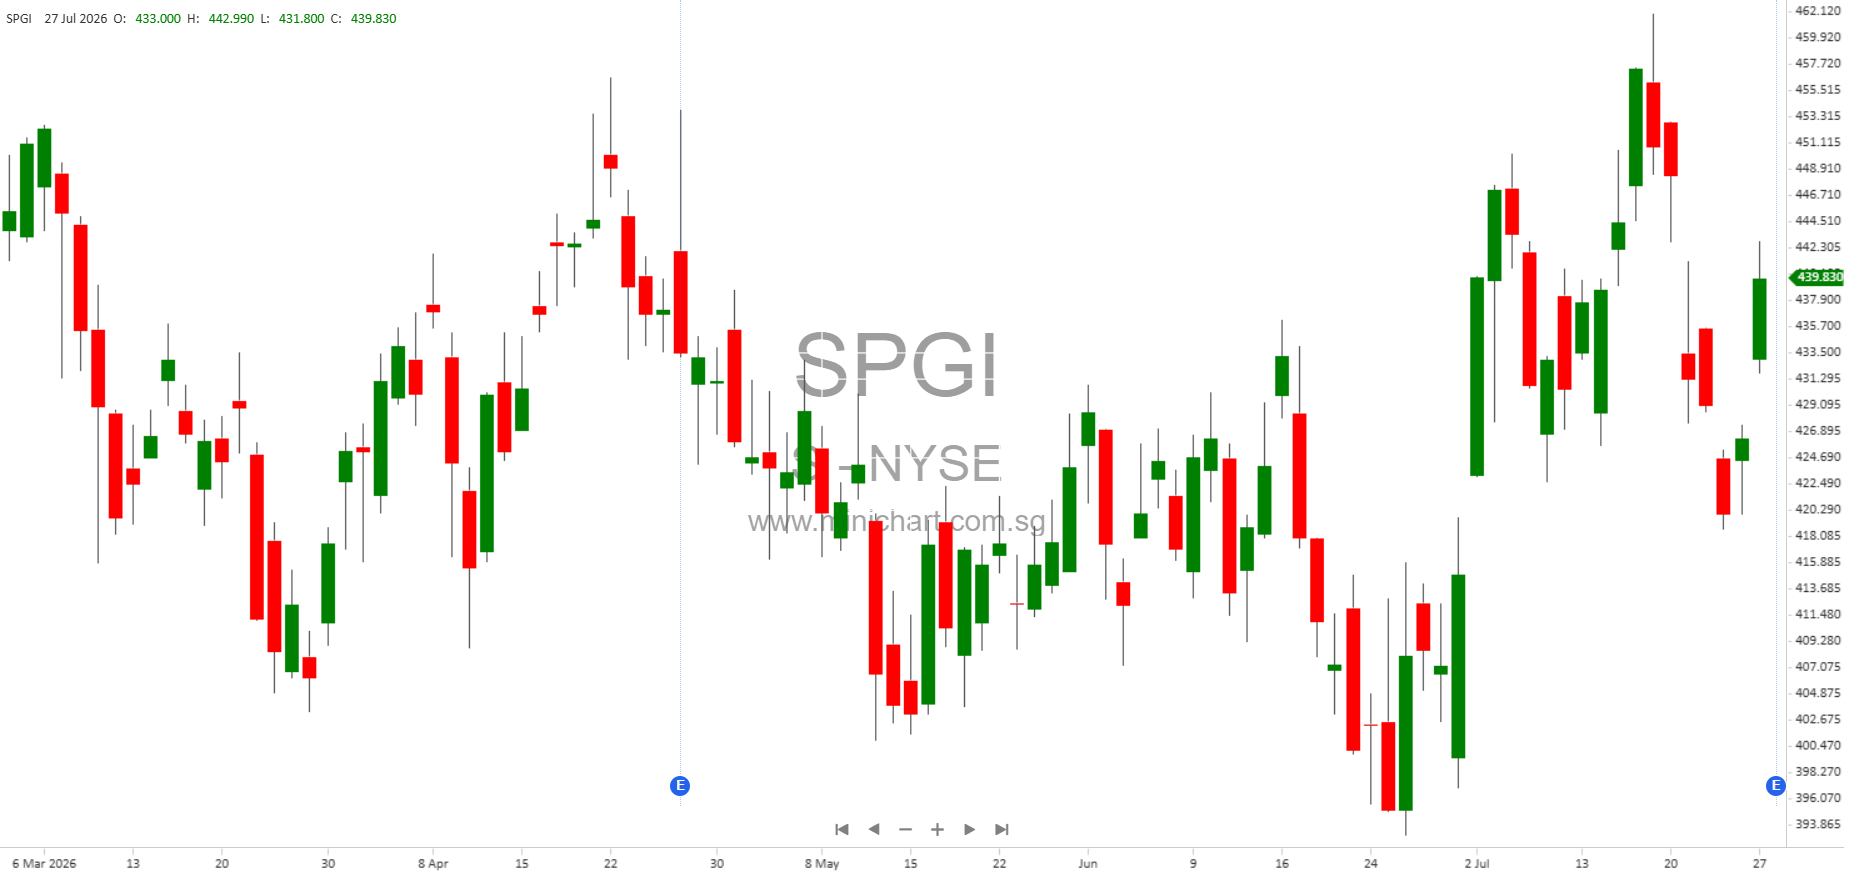
New York, NY – July 28, 2026 – S&P Global Inc. (NYSE: SPGI) has announced its financial results for the second quarter ended June 30, 2026, posting robust growth across revenue, profit, and earnings per share. The company also provided fresh guidance for the remainder of the year and highlighted several strategic developments that could be key for shareholders and market watchers.
Key Financial Highlights
- Pro Forma Revenue: \$3.678 billion, up 11% year-over-year.
- Adjusted Operating Profit: \$1.998 billion, up 15% year-over-year.
- Adjusted Diluted EPS: \$4.83, up 23% year-over-year.
- Pro Forma Operating Margin: Increased by 410 basis points; adjusted margin up 200 basis points.
- Net Income: \$1.323 billion, up 14% from the prior year’s quarter.
- Net Income Attributable to S&P Global Inc.: \$1.217 billion.
- Repurchased Shares: \$500 million of company stock in Q2 (excluding Mobility segment).
- Quarterly Cash Dividend: Maintained at \$0.97 per share.
Strategic and Operational Developments
- Spin-off of Mobility Global: S&P Global successfully completed the spin-off of its Mobility Global unit as an independent, public company on July 1, 2026. The company now has a sharper focus on its four core divisions: Ratings, Indices, Market Intelligence, and Energy.
- Organizational Changes: The company made further organizational changes, combining supply chain products within the Energy division and restructuring Market Intelligence, aiming at profitable growth and efficiency.
- Artificial Intelligence (AI) Expansion: S&P Global has seen “continued rapid adoption and expansion” of its AI solutions across its core businesses, which management highlighted as a key driver of profitable long-term growth.
- Record Results in Key Segments: The Ratings and Indices divisions delivered record results for the quarter, a testament to ongoing demand for credit ratings, indices, and investment products tracking these benchmarks.
Detailed Segment Performance
- Ratings: Revenue and margin growth, driven by strong demand for credit ratings and improved credit market activity.
- Indices: Continued asset inflows and product innovation, with increased demand for index-linked investment products and derivatives.
- Market Intelligence: Revenue rose 6% year-over-year, with the division benefitting from AI-driven product enhancements and the integration of supply chain offerings.
- Energy: Revenue growth as division portfolio was realigned to absorb supply chain businesses and support energy transition market demand.
2026 Guidance and Outlook
| Metric | GAAP (Range) | Adjusted (Range) |
|---|---|---|
| Revenue Growth | 5.9% to 7.9% | 5.9% to 7.9% |
| Organic, Constant Currency Revenue Growth | — | 6.0% to 8.0% |
| Operating Profit Margin Expansion | 335 to 360 bps | 390 to 410 bps |
| Diluted EPS | \$16.35 to \$16.60 | \$17.50 to \$17.75 |
| Capital Expenditures | \$190 to \$210 million | \$190 to \$210 million |
| Tax Rate | 22% to 23% | 22% to 23% |
| Deal-related Amortization | ~\$785 million | ~\$785 million |
| Corporate Unallocated Expense | \$205 to \$215 million | \$185 to \$195 million |
Dividend Policy: The Board of Directors has reaffirmed the quarterly dividend at \$0.97, reflecting confidence in ongoing cash flows and capital allocation strategy.
Cash Flow, Balance Sheet, and Capital Management
- Operating Cash Flow (Six Months Ended June 30, 2026): \$2.476 billion.
- Capital Expenditures (Six Months): \$15 million.
- Share Repurchases: \$1.5 billion for the six months ended June 30, 2026.
- Dividends Paid to Shareholders (Six Months): \$575 million.
- Total Equity (June 30, 2026): \$31.6 billion.
- Cash, Cash Equivalents, and Restricted Cash (June 30, 2026): \$6.3 billion.
Potentially Price-Sensitive Items for Investors
- Strong Earnings Beat: The company’s results exceeded consensus expectations on revenue, profit and EPS, with upward momentum in key segments. This could be supportive for the share price if market expectations were lower.
- Spin-off of Mobility Global: The successful separation and public listing of Mobility Global refocuses S&P Global on its core, higher-margin businesses, and could unlock additional shareholder value.
- Ongoing AI Expansion: The company’s explicit callout of rapid AI adoption and integration as a growth lever may increase investor confidence in S&P’s ability to compete and grow margins in a changing financial data landscape.
- Substantial Share Buybacks: Significant capital returned via buybacks (\$500 million in Q2, \$1.5 billion YTD) could support earnings per share and signal management’s confidence in intrinsic value.
- Dividend Maintenance: The continued \$0.97 per share dividend signals the company’s financial stability and commitment to shareholder returns.
- Upbeat Guidance: Full-year 2026 guidance implies continued double-digit EPS growth and robust margin expansion, which may be a positive catalyst for the stock.
Risks and Forward-Looking Statements
S&P Global highlighted a number of risk factors that could impact future results, including global economic and geopolitical uncertainty, financial market volatility, regulatory changes, cybersecurity risks, litigation, competitive pressures (including from new AI-powered products), and the potential impact from the separation of the Mobility Global business. The company emphasized that forward-looking statements are subject to change and actual results may differ materially.
About S&P Global
S&P Global is a leading provider of benchmarks, data, analytics, and technology to businesses, governments, and individuals worldwide. The company’s four core divisions are Ratings, Indices, Market Intelligence, and Energy. More information for investors can be found at http://investor.spglobal.com.
Contact for Investors:
Mark Grant, Senior Vice President, Investor Relations and Treasurer
Tel: +1 (347) 640-1521
Email: [email protected]
Disclaimer
This article is a summary and analysis based on S&P Global Inc.’s Form 8-K and related earnings release for Q2 2026. The information provided is for informational purposes only and does not constitute financial advice or a recommendation to buy or sell securities. Investors should review the full SEC filings and consult their financial advisors before making investment decisions. Forward-looking statements are subject to risks and uncertainties, and actual results may differ materially.