Rhinebeck Bancorp, Inc. Reports Q2 2026 Results and Completes Second-Step Conversion
Key Highlights for Investors
- Net Income and Earnings: Rhinebeck Bancorp, Inc. (NASDAQ: RBKB) reported net income of \$2.6 million for Q2 2026 (\$0.24 per basic and diluted share), a decrease of 4.0% compared to the prior year. For the first half of 2026, net income was \$4.8 million (\$0.45 per basic, \$0.44 per diluted share), down 3.6% year-over-year.
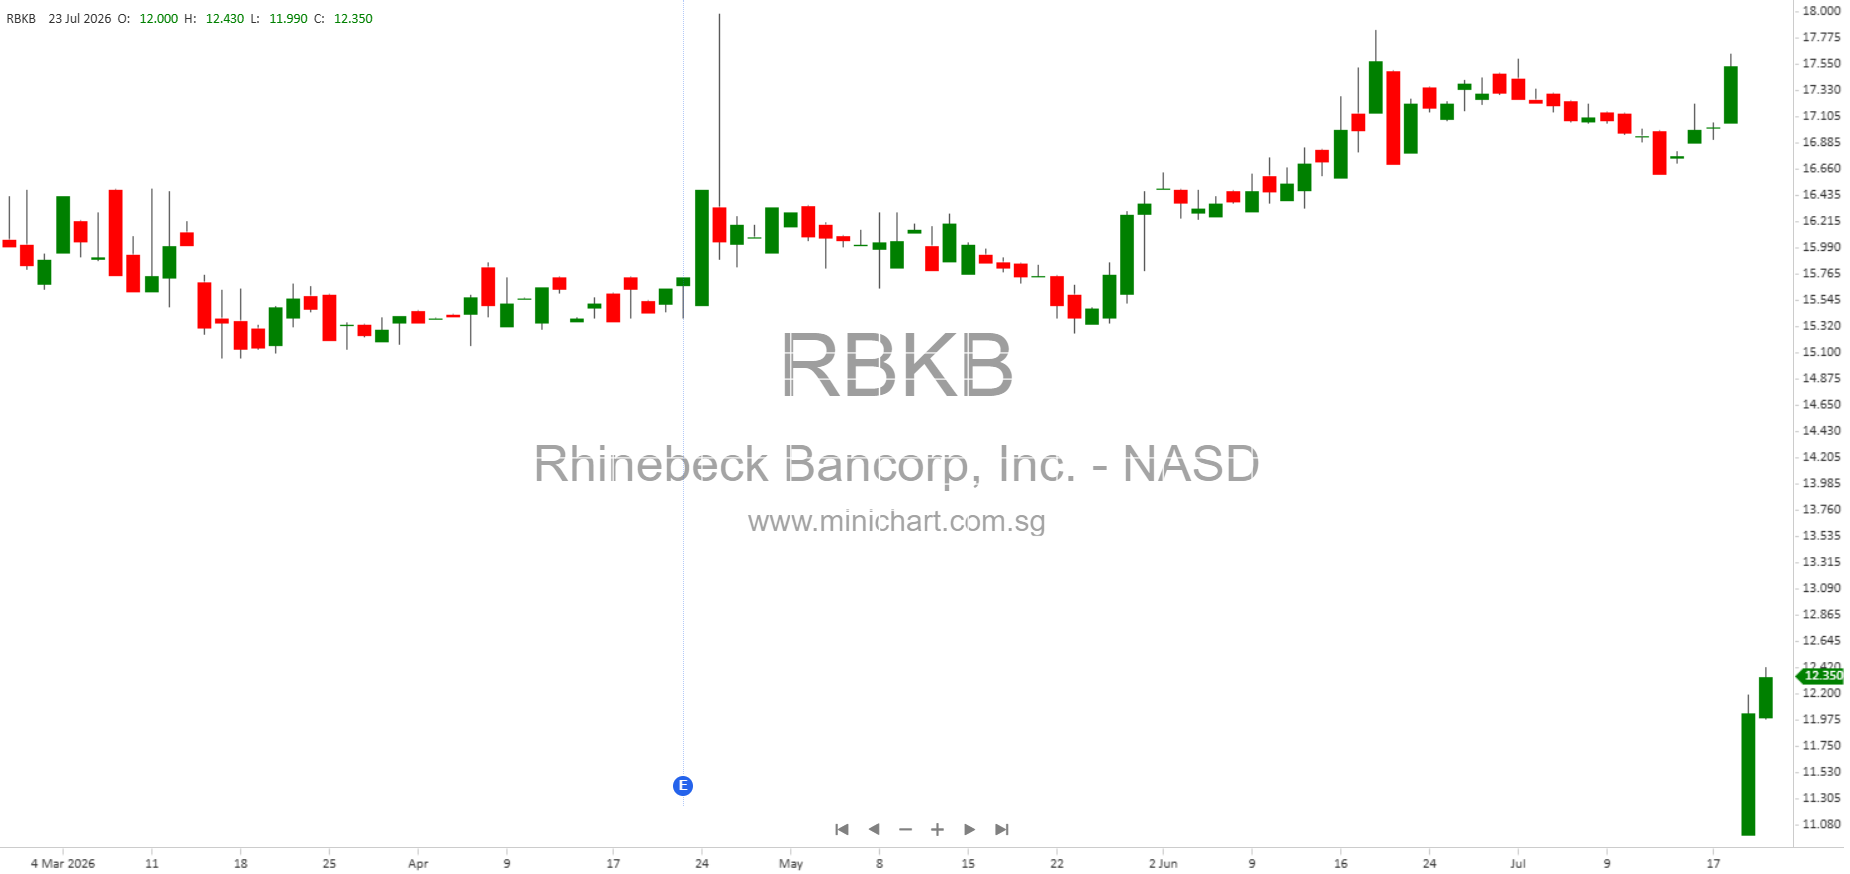
- Second-Step Conversion and Capital Raise: On July 21, 2026, Rhinebeck Bancorp completed its second-step conversion, eliminating its mutual holding company parent. The company raised \$88.8 million in gross proceeds through a public offering, selling 8,880,210 shares at \$10.00 per share. All existing shares were exchanged at a ratio of 1.3978 new shares for each old share, with cash paid in lieu of fractional shares. Post-transaction, shares outstanding will total 15,638,237 (subject to fractional adjustments).
- Financial Performance:
- Net interest income increased 1.2% year-over-year for Q2, and 1.3% for the first half.
- Non-interest income rose 8.8% in Q2, but was down 4.3% year-to-date due to lower gains on loan sales and other non-interest income, partly offset by higher investment advisory fees.
- Past due loans fell 34.6% since year-end, reflecting improved asset quality and tighter underwriting standards, especially in indirect auto loans.
- Deposits increased \$29.6 million (2.7%) excluding stock subscription funds from December 2025.
- Second-step conversion significantly strengthens capital position, providing funds for growth initiatives.
Detailed Financial Analysis
Income Statement
- Net Interest Income: Q2 net interest income was \$11.6 million (up \$140,000), driven by higher interest-earning asset balances and lower costs on interest-bearing liabilities. However, net interest margin fell by 19 basis points to 3.78%, and the interest rate spread declined to 3.20% from 3.33% last year. Year-to-date, net interest income was \$22.8 million (up \$297,000), with net interest margin down to 3.77%.
- Provision for Credit Losses: The provision was a credit of \$11,000 in Q2, compared to a credit of \$101,000 in Q2 2025. Net charge-offs increased slightly, mainly in indirect auto loans, but were offset by reductions in consumer and commercial loan charge-offs. Year-to-date provision for credit losses decreased sharply to \$60,000 from \$252,000, reflecting lower loan balances.
- Non-Interest Income: Q2 non-interest income was \$1.7 million (up \$141,000), mainly due to a 57.6% increase in investment advisory fees. Year-to-date, non-interest income fell by \$144,000, driven by decreases in gains on loan sales and other non-interest income, offset by higher investment advisory income.
- Non-Interest Expense: Q2 non-interest expense rose 3.1% to \$10.0 million, mainly due to higher salaries, benefits, professional fees, and data processing costs. This was partially offset by lower marketing and insurance expenses. Year-to-date, non-interest expense increased by 2.8% to \$19.7 million.
Balance Sheet
- Total Assets: Assets grew by \$168.3 million (12.9%) to \$1.47 billion at June 30, 2026, primarily due to a \$202.6 million increase in cash and cash equivalents, including \$156.0 million in stock subscription funds pending offering closure.
- Securities and Loans: Available-for-sale securities increased by \$9.2 million. Loans receivable fell by \$34.9 million, mainly from strategic reductions in indirect auto, commercial real estate, and commercial & industrial loans, partly offset by higher residential real estate loans.
- Asset Quality: Past due loans decreased \$5.0 million (34.6%), with notable improvement in indirect auto loans. Allowance for credit losses was 0.83% of total loans and 227.06% of non-performing loans. Non-performing assets dropped to \$3.4 million.
- Liabilities: Liabilities rose by \$165.5 million (14.2%), largely due to deposit growth (including stock subscriptions). FHLB borrowings dropped by \$20.0 million. Uninsured deposits made up 36.7% of total deposits, but were 28.0% excluding stock subscription deposits.
- Equity: Stockholders’ equity increased by \$2.8 million to \$139.6 million, driven by net income, offset by stock repurchases and unrealized losses on securities. The ratio of average equity to average assets was 10.59% for the first half of 2026.
Selected Ratios
- Return on average assets: 0.79% in Q2 2026 (down from 0.88% in Q2 2025)
- Return on average equity: 7.56% in Q2 2026 (down from 8.57% in Q2 2025)
- Net interest margin: 3.78% in Q2 2026 (down from 3.97% in Q2 2025)
- Efficiency ratio: 74.83% in Q2 2026
- Tangible book value per common share: \$12.28 at June 30, 2026 (up from \$11.40 at June 30, 2025)
- Tier 1 capital ratio: 14.61% at June 30, 2026 (up from 12.66% at June 30, 2025)
Management Commentary and Outlook
President and CEO Matthew Smith emphasized the company’s progress in repositioning for sustainable growth and profitability. Rhinebeck Bancorp is investing in talent, technology, and capabilities to broaden growth opportunities and strengthen the organization. The second-step conversion was described as a “milestone” that significantly bolsters capital, enabling prudent deployment in commercial banking expansion, retail and digital deposit initiatives, and infrastructure investment.
Shareholder and Price-Sensitive Information
- Second-Step Conversion & Capital Raise: The completion of the second-step conversion and \$88.8 million capital raise is highly significant. It strengthens Rhinebeck Bancorp’s capital base, supports future growth, and may impact share valuation due to dilution (increase in shares outstanding from 11.18 million to 15.64 million).
- Asset Quality Improvement: A sharp reduction in past due loans and non-performing assets, driven by more conservative underwriting, could be viewed positively in terms of risk and future earnings stability.
- Deposit Mix: The high proportion of uninsured deposits (36.7%) may be a risk factor, though normalized to 28.0% excluding stock subscription deposits.
- Loan Portfolio Changes: Strategic reduction of indirect auto and commercial real estate loans signals a shift in risk appetite and business focus, which may affect longer-term earnings and risk profile.
- Margin Compression: Net interest margins and spreads have declined, reflecting the lower-rate environment and increased competition. This may impact future profitability unless offset by asset growth or cost reductions.
- Stock Repurchase: Continued repurchase activity (\$1.8 million) may signal management’s confidence in valuation, but also affects capital deployment.
- Forward-Looking Risks: Management highlighted risks including competitive pressures, inflation, interest rate changes, real estate values, economic conditions, deposit liquidity, cybersecurity, and regulatory changes. These factors could materially affect future results.
Conclusion
Rhinebeck Bancorp’s Q2 2026 report delivers a mixed picture: solid asset quality improvements and a successful capital raise via second-step conversion, but modest earnings declines and margin compression. The conversion and associated capital infusion are highly price-sensitive and pivotal for the company’s future direction, enabling strategic investments and growth initiatives. Investors should closely monitor the ongoing transition in loan portfolio composition, deposit mix, and the impacts of dilution and margin trends on future earnings. These developments are likely to influence share valuation and are significant for shareholders.
Disclaimer: This article is for informational purposes only and does not constitute investment advice or a solicitation to buy or sell securities. Financial results, strategic changes, and forward-looking statements are subject to risks and uncertainties. Investors should perform their own due diligence and consult professional advisors before making financial decisions. The author and publisher assume no liability for any actions taken based on this content.