Glacier Bancorp, Inc. Delivers Record Results for Q2 2026: Investor Deep-Dive
Executive Summary
- Record Net Income: \$97.9 million in Q2 2026, up 19% quarter-over-quarter and 85% year-over-year.
- EPS Growth: Diluted EPS at \$0.75, up 19% QoQ and 67% YoY. Operating diluted EPS (non-GAAP) at \$0.76.
- Net Interest Margin Expansion: Net interest margin (tax-equivalent) at 3.90%, up 10 basis points QoQ and 69 bps YoY.
- Dividend: \$0.33/share declared, marking 165 consecutive quarterly dividends and 49 increases.
- Loan and Deposit Growth: Loans up 15% YoY; deposits up 14% YoY.
- Efficiency Ratio: Improved to 56.65% in Q2, down from 63.05% in Q1 and 62.08% in Q2 2025.
- Tax Rate Increase: Effective tax rate rose to 21.4% in Q2 2026.
- Acquisition Update: Guaranty Bancshares integration completed; contributed to asset, loan, and deposit growth.
- Credit Quality: Allowance for credit losses stable at 1.22%; non-performing assets increased but remain manageable.
- Tangible Equity: Tangible stockholders’ equity up 21% YoY, tangible book value per share up 10% YoY.
Quarterly Results Breakdown
Net Income and Earnings
Glacier Bancorp, Inc. posted record net income of \$97.9 million for Q2 2026, representing a 19% increase from Q1 and an 85% surge compared to Q2 2025. Diluted EPS was \$0.75, up \$0.12 from last quarter and \$0.30 from the same quarter last year. Operating diluted EPS (non-GAAP) was \$0.76, up 9% QoQ and 33% YoY.
Net Interest Income and Margin
Net interest income was \$276 million, up \$7.8 million (3%) QoQ and \$68.8 million (33%) YoY. Net interest margin (tax-equivalent) expanded to 3.90%, up 10 bps QoQ and 69 bps YoY. This marks the tenth consecutive quarter of net interest margin expansion, driven by increased loan yields, a shift in asset mix to higher-yielding loans, and lower core deposit and funding costs.
Loan and Deposit Growth
- Loan portfolio at \$21.364 billion, up \$330 million (6% annualized) QoQ and \$2.831 billion (15%) YoY.
- Total deposits at \$24.654 billion, down slightly QoQ but up \$3.026 billion (14%) YoY.
- Non-interest bearing deposits represent 30% of total deposits, up 13% YoY to \$7.423 billion.
- Excluding acquisitions, loans grew organically by \$728 million (4%) YoY, and deposits by \$319 million (1%) YoY.
Dividend Announcement
The Board declared a quarterly dividend of \$0.33/share, payable July 16, 2026. This extends the streak to 165 consecutive quarterly dividends, with 49 increases, demonstrating strong and consistent capital return.
Efficiency and Expense Management
The efficiency ratio improved to 56.65% in Q2 2026 from 63.05% in Q1 and 62.08% in Q2 2025. Operating efficiency ratio (non-GAAP) was 56.21%. Non-interest expense decreased \$13.8 million QoQ, primarily due to lower acquisition-related costs and increased gains from asset sales.
- Compensation and employee benefits up \$21.9 million YoY (23%), reflecting annual salary increases and staffing growth from acquisitions.
- Acquisition-related expenses were \$1.6 million in Q2, down from \$8.9 million in Q1.
Credit Quality and Provision
Provision for credit loss was \$6.4 million in Q2, with allowance for credit losses (ACL) stable at 1.22% of total loans. Non-performing assets totaled \$91.8 million, up \$12.4 million QoQ and \$43.2 million YoY, but remain at 0.29% of subsidiary assets. Net charge-offs were \$5.9 million, including \$2.8 million in deposit overdraft charge-offs and \$3.1 million in loan charge-offs.
Tax and Regulatory Matters
Federal and state income tax expense rose to \$26.6 million in Q2, up 48% QoQ and 115% YoY. The effective tax rate increased to 21.4% from 18.0% in Q1 and 19.02% in Q2 2025, largely due to higher pre-tax income and reduced federal tax credits.
Balance Sheet and Capital Strength
- Total assets: \$31.60 billion (up from \$29.00 billion in Q2 2025).
- Tangible stockholders’ equity: \$2.839 billion, up \$493 million (21%) YoY, driven by earnings retention and stock issued for the Guaranty acquisition.
- Tangible book value per share: \$21.81, up 10% YoY.
Acquisition Update
The integration of Guaranty Bancshares, Inc. was completed, contributing \$3.357 billion in assets, as well as significant growth in loans and deposits. Acquisition-related expenses totaled \$10.5 million in the first half of 2026, compared to \$3.8 million in the prior year.
Key Risk Factors for Investors
- Potential adverse changes in credit quality.
- Interest rate policy shifts and broader economic uncertainty.
- Legislative or regulatory changes, including FDIC insurance rates and bank merger regulations.
- Risks related to further acquisitions and integration.
- Natural disasters, geopolitical instability, and technology/cybersecurity risks.
- Changes in competitive landscape, including new market entrants and digital banking threats.
Forward-Looking Statements
Management highlighted the strength of the diversified community banking model, disciplined balance sheet management, and robust loan and deposit growth. However, investors should note a range of risks, including credit quality, regulatory, and macroeconomic factors that could materially impact future performance.
Conclusion: Investment Implications
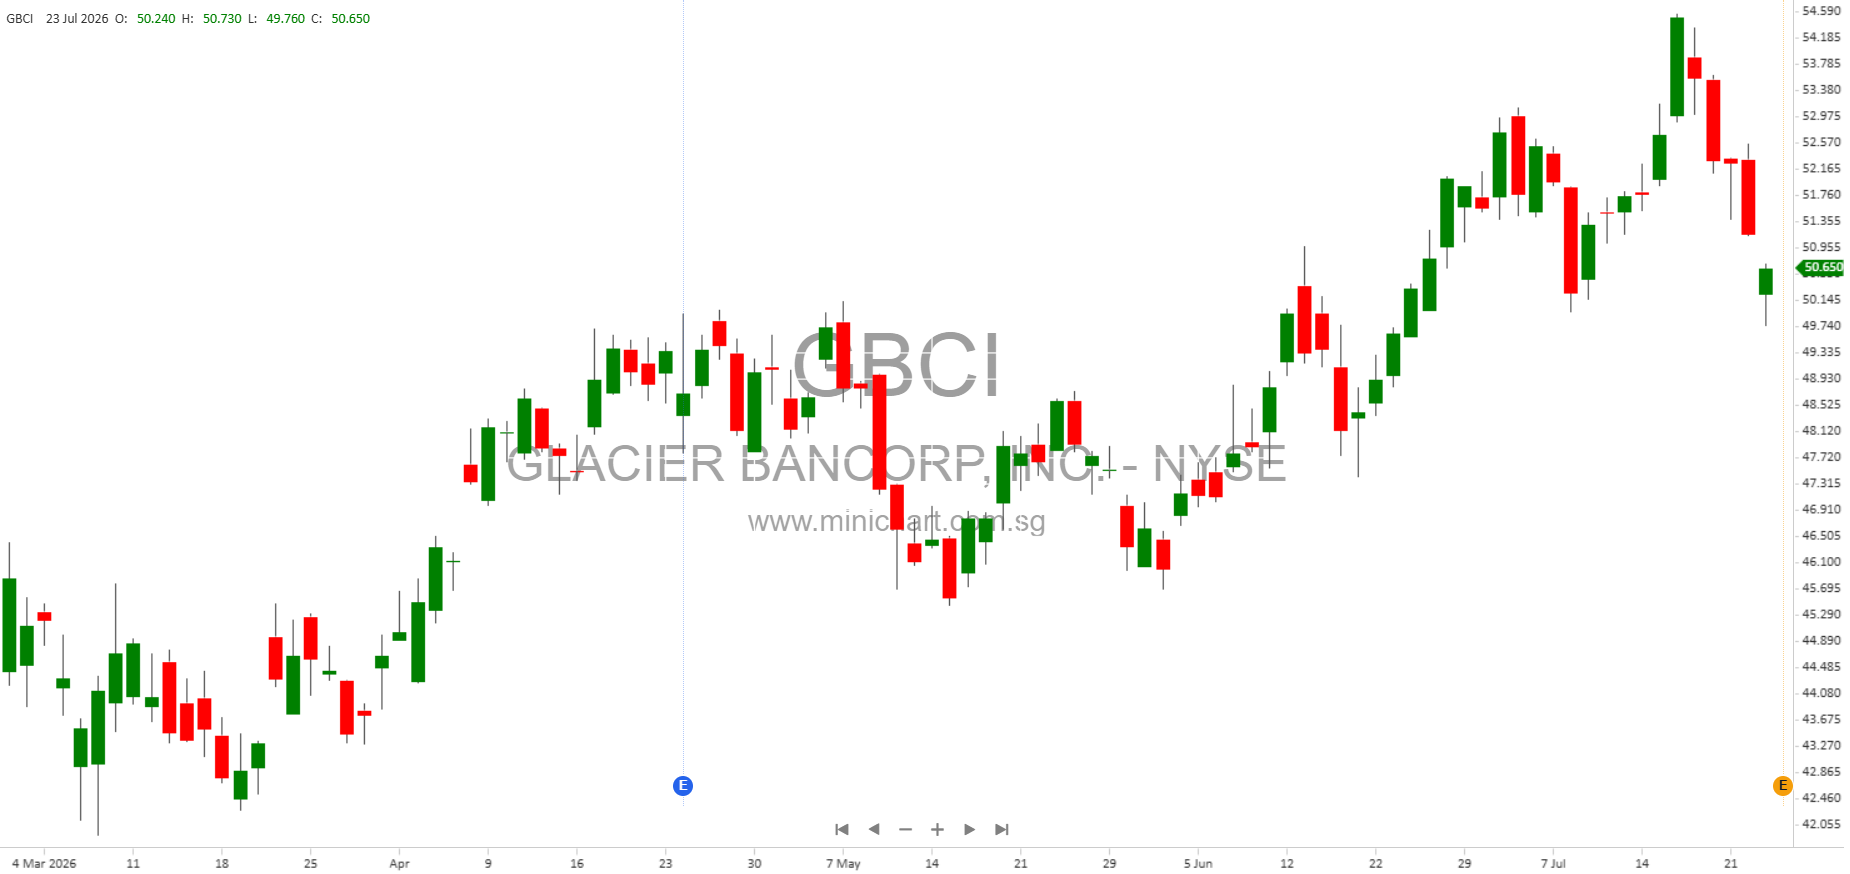
Glacier Bancorp, Inc. has delivered a record quarter with strong EPS growth, margin expansion, and consistent dividend performance. The completion of the Guaranty acquisition has accelerated asset and earnings growth, and the company has demonstrated effective expense management and credit quality discipline. These results are likely to be price-sensitive, with positive implications for share value, especially given the ongoing margin expansion and robust capital position. However, investors should remain vigilant regarding credit quality trends, tax rate increases, and broader economic and regulatory risks.
Disclaimer: This article is for informational purposes only and does not constitute investment advice. The information is based on unaudited financial statements and management commentary and may be subject to change. Investors should conduct their own due diligence and consult with a financial advisor before making investment decisions. Past performance is not indicative of future results.