Asbury Automotive Group Q2 2026 Financial Results: Key Takeaways for Investors
Executive Summary
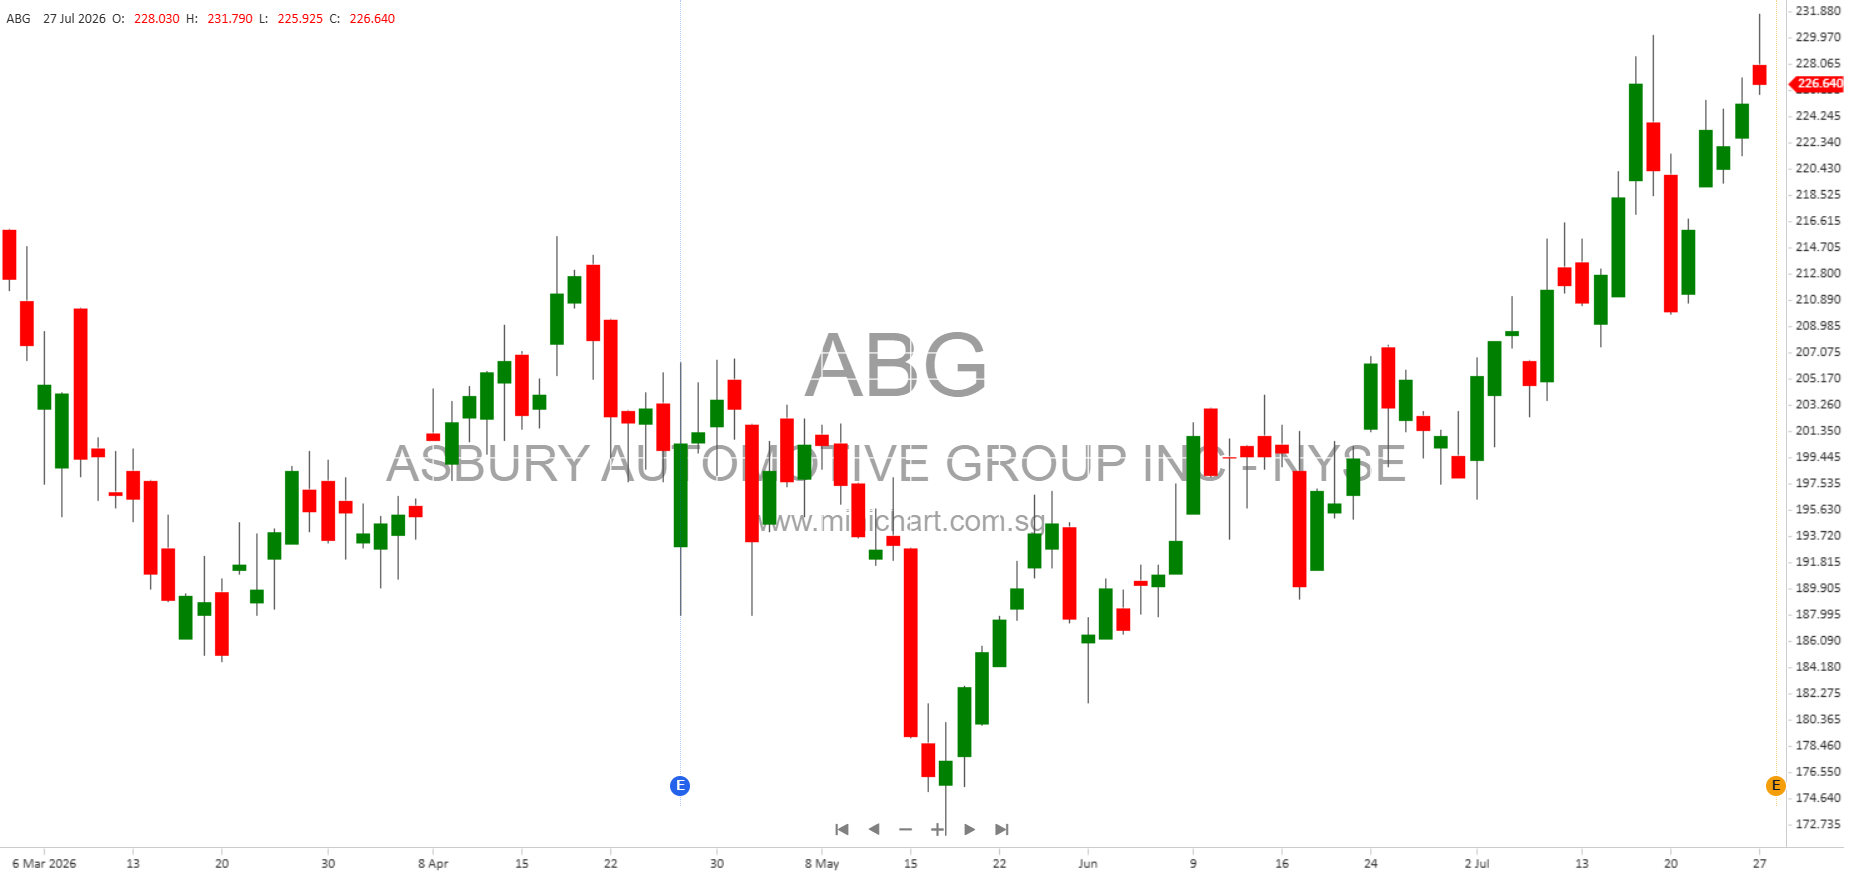
Asbury Automotive Group, Inc. (NYSE: ABG), one of the largest automotive retail and service companies in the U.S., has reported its financial results for the second quarter of 2026. The report contains several critical financial and operational highlights, including revenue, earnings, share repurchases, and strategic technology transformation milestones, all of which are of considerable importance to shareholders and could influence the company’s share price.
Key Financial Highlights
- Revenue: \$4.4 billion for Q2 2026, nearly flat compared to Q2 2025.
- Gross Profit: \$753 million, gross margin of 17.2%.
- Net Income: \$115 million (\$6.25 per diluted share), down 25% from \$153 million (\$7.76 per diluted share) in Q2 2025.
- Adjusted Net Income (Non-GAAP): \$125 million (\$6.82 per diluted share), down 15% from \$146 million (\$7.43 per diluted share) in Q2 2025.
- Used Retail Gross Profit Per Unit: \$2,002, up 16% year-over-year.
- Finance & Insurance (F&I) Per Vehicle Retailed: \$2,216.
- SG&A Expenses: 67.2% of gross profit (adjusted: 66.0%).
- Operating Margin: 5.0% (adjusted: 5.3%).
- Liquidity: \$966 million as of June 30, 2026.
- Transaction Adjusted Net Leverage Ratio: 3.4x at quarter end.
Shareholder-Focused Developments
- Share Repurchases: Approximately 668,000 shares repurchased for \$131 million in Q2 2026; year-to-date total repurchases at 1.35 million shares for \$278 million. \$322 million remains on the repurchase authorization.
- Tekion Implementation: 70% of stores converted to Tekion dealership management system as part of enterprise technology transformation, on track for full rollout by Fall 2026. Management expects this investment to enhance guest experience and operational efficiency, potentially supporting long-term value creation.
Operational Performance Details
Total Company
- New Vehicle Revenue: \$2.3 billion
- Used Vehicle Retail Revenue: \$1.1 billion; gross profit \$66 million
- Parts & Service Revenue: \$635 million; gross profit \$374 million
- SG&A as % of Gross Profit: 67.2% (adjusted 66.0%)
- Operating Margin: 5.0% (adjusted 5.3%)
Same Store Performance
- Revenue: \$3.8 billion
- Gross Profit: \$643 million
- New Vehicle Revenue: \$2.0 billion
- Used Vehicle Retail Revenue: \$930 million; gross profit \$56 million
- Parts & Service Revenue: \$551 million; gross profit \$323 million
- SG&A as % of Gross Profit: 66.4% (adjusted 65.3%)
- Operating Margin: 5.2% (adjusted 5.4%)
Important Adjustments & Non-GAAP Items
- Q2 2026 Adjusted Net Income Excludes (net of tax):
- \$4 million (\$0.24 per diluted share) related to Tekion implementation expenses
- \$3 million (\$0.17 per diluted share) non-cash asset impairments
- \$2 million (\$0.10 per diluted share) weather-related losses
- \$1 million (\$0.05 per diluted share) duplicative DMS-related expenses
- Q2 2025 Adjusted Net Income Excludes (net of tax):
- \$4 million cyber insurance recovery proceeds (\$0.19 per diluted share)
- \$4 million gain on divestitures (\$0.23 per diluted share)
- \$2 million professional fees related to acquisition (\$0.09 per diluted share)
Brand Mix and Segment Performance
| Brand | 2026 | 2025 |
|---|---|---|
| Lexus | 10% | 11% |
| Mercedes-Benz | 7% | 7% |
| BMW | 7% | 2% |
| Porsche | 2% | 2% |
| Land Rover | 2% | 2% |
| Other luxury | 6% | 6% |
| Total luxury | 32% | 30% |
| Toyota | 21% | 20% |
| Honda | 10% | 9% |
| Hyundai | 5% | 5% |
| Kia | 2% | 2% |
| Other imports | 4% | 4% |
| Total imports | 42% | 40% |
| Ford | 13% | 13% |
| Chrysler/Jeep/Ram | 6% | 9% |
| Chevrolet/Buick/GMC | 6% | 7% |
| Total domestic | 26% | 30% |
Operational Metrics of Note
- Average Selling Price: New vehicle \$52,666 (+2%), Used vehicle retail \$33,054 (+6%)
- Average Gross Profit Per Unit: New vehicle \$3,124 (-13%), Used vehicle retail \$2,002 (+16%)
- Front End Yield: \$4,860 (flat)
- Gross Margin: Total 17.2% (flat)
Balance Sheet and Liquidity
- Cash & Equivalents: \$30.4 million as of June 30, 2026
- Inventory: \$2,108.6 million
- Total Current Assets: \$3,082.4 million
- Long-Term Debt: \$3,457.6 million (down 3%)
- Shareholders’ Equity: \$3,923.2 million (up 1%)
- Total Capitalization: \$7,380.8 million (down 1%)
- Days Supply: New vehicle inventory 54 days, Used vehicle inventory 39 days
Strategic and Technology Initiatives
Asbury’s ongoing enterprise technology transformation featured the rollout of the Tekion dealership management system (DMS), with 70% of stores converted as of Q2 2026. Management reiterated that the rollout is on schedule for completion by Fall 2026. The conversion is expected to deliver meaningful long-term value, enhance the guest experience, and equip teams with modern tools. Early signs point to operating improvements in converted stores.
Share Repurchase Program
The company repurchased 668,000 shares for \$131 million during Q2 2026. Year-to-date, Asbury has repurchased 1.35 million shares for \$278 million. \$322 million remains authorized for future repurchases. Management states repurchases will depend on stock price, economic conditions, capital structure impacts, returns on capital, and other strategic considerations. The program can be modified, suspended, or terminated at any time.
Risks and Forward-Looking Statements
The report includes forward-looking statements regarding technology transitions, operational improvements, capital allocation, integration of acquisitions, and other strategic goals. Risks cited include supply chain disruptions, economic and market conditions, litigation, acquisition integration, technology implementation, and the ability to realize anticipated benefits from strategic initiatives and acquisitions.
Important Considerations for Investors
- The decline in net income and adjusted net income year-over-year may be viewed negatively by investors, especially given the rise in SG&A expenses as a percentage of gross profit.
- The positive increase in used retail gross profit per unit and strong F&I per vehicle metrics are encouraging, signaling improved profitability in some segments.
- The successful rollout and operational improvements from the Tekion DMS transformation could be a long-term positive catalyst, though near-term costs and execution risks remain.
- The substantial share repurchase activity and remaining authorization may provide some support to share value, though the impact will depend on broader market and company-specific factors.
- Liquidity and leverage remain strong, providing flexibility for future acquisitions, capital investments, and shareholder returns.
- Brand mix and segment performance highlight Asbury’s diversification across luxury, import, and domestic brands, with luxury and import segments showing resilience.
- Investors should monitor future earnings calls and management guidance for updates on the Tekion rollout, capital allocation, and any material operational or market changes.
Upcoming Events
Asbury will hold its earnings conference call on Tuesday, July 28, 2026, at 10:00 a.m. ET, with live webcast and supplemental materials accessible at investors.asburyauto.com.
Conclusion
The Q2 2026 results reflect both challenges and progress for Asbury Automotive Group. While earnings declined year-over-year, the company continues to invest in technology, optimize operations, and return capital to shareholders through repurchases. The technology transformation with Tekion, steady used vehicle profitability, and robust liquidity position are potential positives that could drive future value, but investors should be mindful of execution and market risks.
Disclaimer: This article is for informational purposes only and does not constitute investment advice. All forward-looking statements are subject to risks and uncertainties as described in Asbury Automotive Group’s filings with the SEC. Investors should conduct their own research and consult with financial advisors before making investment decisions.