Vera Bradley, Inc. Q1 2026 Financial Report: Key Highlights and Investor Insights
Date: For the quarter ended May 2, 2026
Ticker: NASDAQ Global Select Market
Key Points from the Q1 2026 Financial Report
- Net Loss Narrows: Vera Bradley, Inc. reported a net loss of \$4.8 million for the quarter ended May 2, 2026, a significant improvement compared to the net loss of \$33.5 million in the prior year period.
- Total Shareholders’ Equity: The company closed the quarter with shareholders’ equity of \$127.0 million, compared to \$146.0 million a year ago.
- Outstanding Shares: Common shares outstanding as of June 4, 2026, were 28,438,252.
-
Basic and Diluted Net Loss Per Share:
- Q1 2026: (\$0.17) per share
- Q1 2025: (\$1.20) per share
- No Preferred Stock Issued: The company has 5,000,000 preferred shares authorized, but none issued or outstanding.
- Stock Buyback: High treasury stock value at \$156.8 million (unchanged year-over-year), indicating substantial buybacks or purchases held in treasury.
- Stock-Based Compensation: Recognized \$1.0 million in stock-based compensation expense for the quarter, up from \$754,000 in the prior year.
- Translation Adjustments: Minor impact from foreign currency translation adjustments.
Important Issues for Shareholders and Price-Sensitive Information
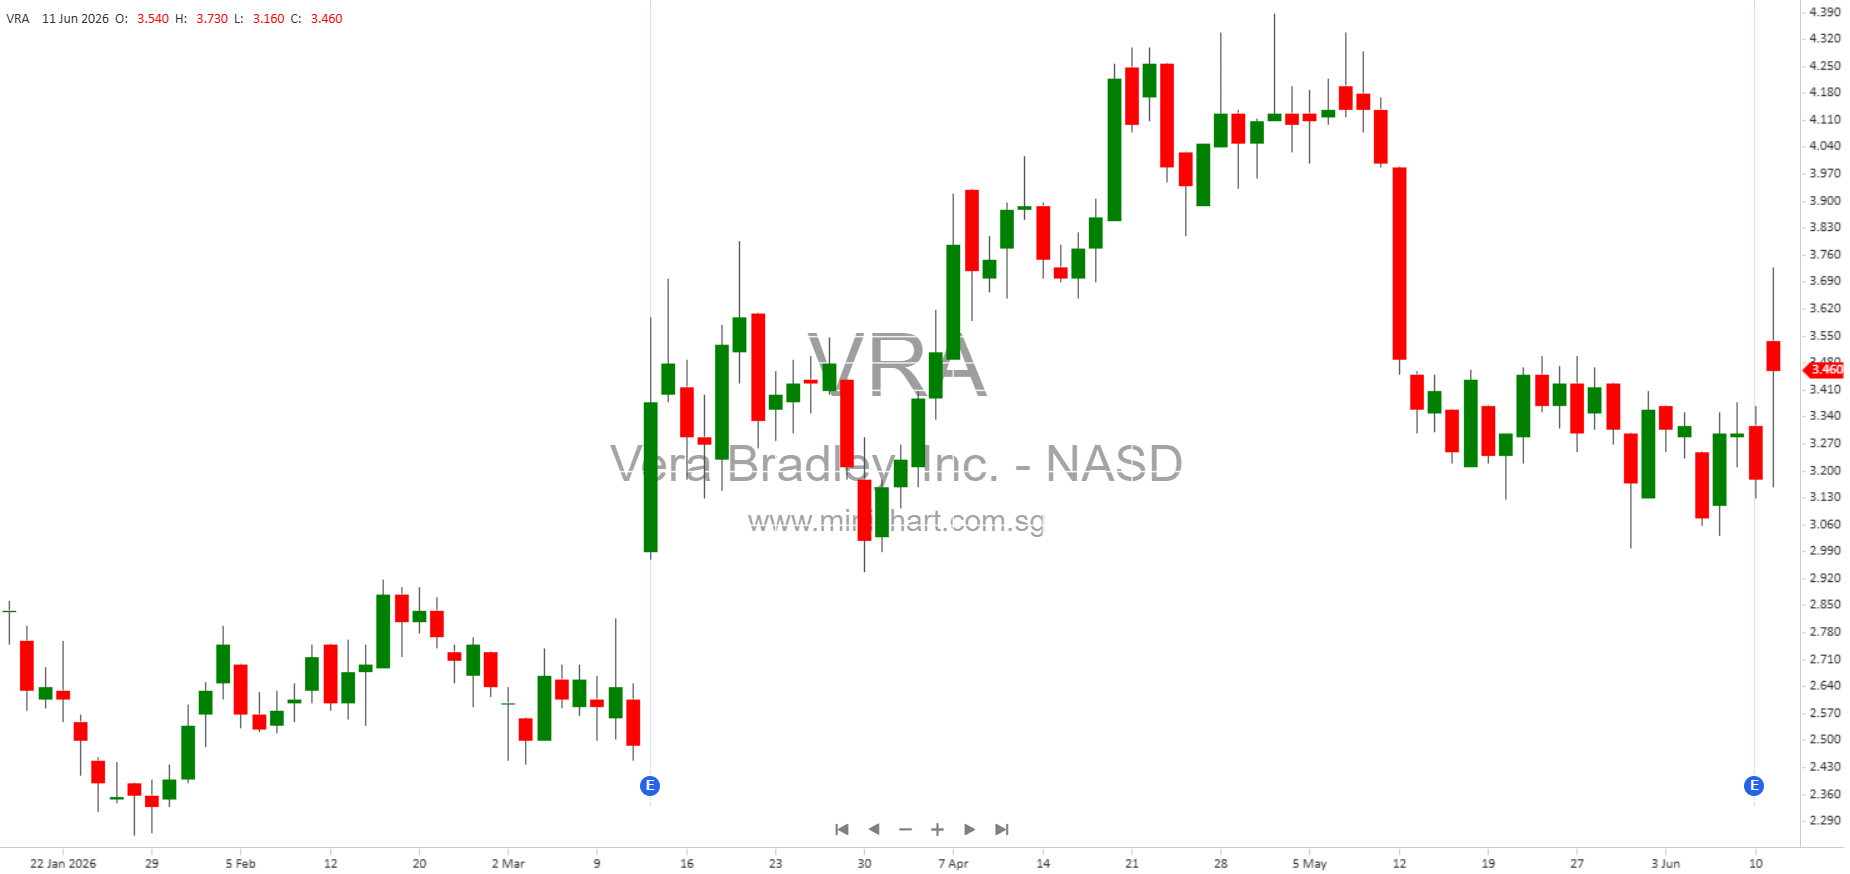
- Significant Improvement in Net Loss: The sharp reduction in net loss from \$33.5 million last year to \$4.8 million this quarter is a highly positive development. This suggests improved operational efficiency or cost control, and should be considered bullish for the stock, potentially supporting a share price recovery or upward momentum.
- Stable Shareholder Equity Despite Losses: While there is a decline in total equity year-over-year, the company remains well-capitalized. This is important for shareholder confidence, particularly in a challenging retail environment.
- No Change in Treasury Stock: The stagnant treasury stock value may raise questions about capital allocation and future buybacks/dividends. Shareholders may want clarification on buyback strategy.
- No Indication of Shell Company Status or Transition Period: Vera Bradley is not a shell company, and continues to file as a non-accelerated filer with no transition reporting, maintaining regulatory compliance.
- Forward-Looking Statements and Risk Factors: The company reminds investors that forward-looking statements are subject to known and unknown risks, including the ability to implement strategic plans and other uncertainties that could impact performance.
-
Potential for Share Price Movement:
- The marked reduction in net loss and improvement in per-share results is a potential catalyst for positive share price movement.
- Shareholders should monitor upcoming management commentary and any updates on strategic initiatives or cost-saving measures, as these could further strengthen investor sentiment.
Additional Details
- Reporting and Compliance: Vera Bradley has consistently filed all required reports over the past 12 months and has posted all required interactive data files, signaling robust compliance and transparency.
- Filer Status: The company is a non-accelerated filer and not classified as a smaller reporting or emerging growth company.
Conclusion
The Q1 2026 report from Vera Bradley, Inc. underscores a substantial improvement in financial results compared to the previous year, with net loss sharply reduced and earnings per share losses narrowing. Shareholders should view these results as a sign of operational progress and financial stabilization. The stock could see positive momentum if the trend continues and management articulates a clear path to profitability.
Investors are encouraged to review the full financial statements and upcoming management discussion for further insights into strategic direction and risk factors.
Disclaimer:
This article is for informational purposes only and does not constitute investment advice. All statements and data are derived from the company’s public filings and may be subject to risks and uncertainties. Investors should conduct their own due diligence and consult with a financial advisor before making any investment decisions. Share price movements may be influenced by numerous factors beyond those discussed here.