Flagstar Bank Posts Second Consecutive Quarter of Profitability in Q1 2026
Key Financial Highlights
- Net Income: Flagstar Bank, N.A. (“Bank”) reported net income of \$21 million for Q1 2026, compared to \$29 million in Q4 2025, and a net loss of \$100 million in Q1 2025.
- Net Income Attributable to Common Stockholders: \$13 million, or \$0.03 per diluted share, compared to \$21 million (\$0.05/share) in Q4 2025 and a net loss of \$108 million (\$0.26/share) in Q1 2025.
- Adjusted Net Income Attributable to Common Stockholders: \$20 million, or \$0.04 per diluted share, excluding a \$9 million fair value loss on the Figure Technology Solutions, Inc. investment.
- Net Interest Income: \$443 million for Q1 2026. Net interest margin increased to 2.15%, up 1 basis point from Q4; adjusted NIM up 10 basis points excluding hedge gain recognition.
- Core Deposits: Grew by \$1.1 billion (2%) quarter-over-quarter, excluding brokered deposits. Total deposits up \$832 million (1%).
- C&I Lending: Total C&I loans grew by \$1.4 billion (9%) compared to prior quarter, with strategic focus areas growing \$838 million (14%) and other categories up \$514 million (6%).
- Credit Quality: Non-accrual loans declined by 11%, criticized/classified loans decreased by 3% quarter-over-quarter.
- CRE Exposure: Commercial real estate exposure reduced further; payoffs of \$1.1 billion including 42% in substandard, CRE concentration ratio down 3%.
- Expense Management: Operating expenses down 5% quarter-over-quarter; adjusted operating expenses down \$44 million (9%) year-over-year.
- CET1 Capital Ratio: Increased to 13.24%, up 40 bps from prior quarter and above peer group levels.
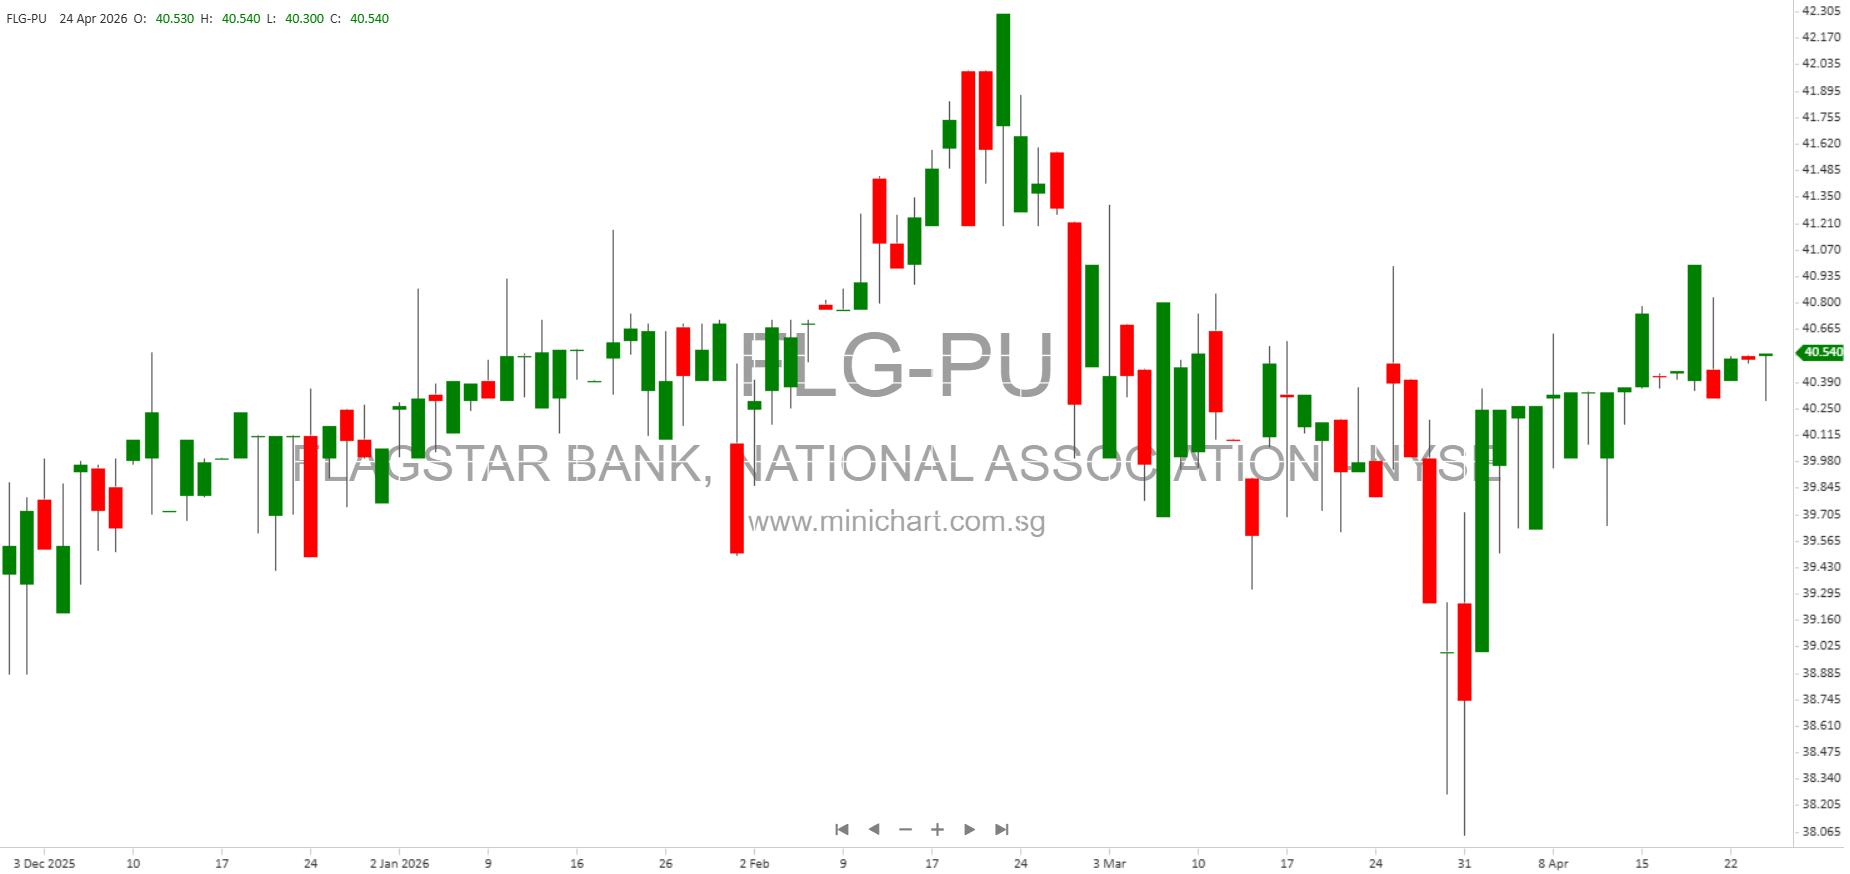
- Tangible Book Value: \$17.42 per share; adjusted for warrant exercise, \$15.70 per share.
- Regulatory Ratings: Both Fitch and Moody’s upgraded several ratings, including raising long-term and short-term deposits to investment grade.
CEO Commentary
“We are pleased to report another quarter of solid progress, highlighted by our second consecutive quarter of profitability and continued momentum across our core banking franchise… Our first quarter 2026 performance reflects the disciplined execution of our strategic plan and improving fundamentals, including strong C&I loan growth, a higher level of deposits, additional progress in reducing the level of non-accrual and criticized/classified loans, further expansion of our net interest margin, and a strong capital position.”
– Joseph M. Otting, Chairman, President, and CEO
Detailed Financial Analysis
Profitability
- Adjusted pre-provision net revenue (PPNR) was \$41 million, up 4% excluding hedge gain recognition in Q4 2025.
- First quarter NIM was flat; adjusted NIM increased by 10 basis points to 2.15%.
- Excess capital of \$1.6 billion (using low end of target CET1 range of 10.5%).
Loans and Deposits
- Strategic C&I lending focus areas expanded by \$838 million (14%), other C&I up \$514 million (6%).
- Average interest-bearing liabilities declined \$2.9 billion (4%) to \$65.6 billion.
- CRE exposure reduced, with significant payoffs and improved concentration ratio.
Credit Quality and Asset Management
- Non-accrual held-for-investment loans and repossessed assets declined by 11%.
- Allowance for credit losses on loans remained strong, supporting asset quality improvements.
Expense Management
- Operating expenses down 5% quarter-over-quarter.
- Year-over-year, adjusted operating expenses fell \$44 million (9%), driven by lower FDIC insurance expense (\$20 million), compensation and benefits (\$16 million), and general/admin expenses (\$15 million).
Capital Position
- Regulatory capital ratios well above “Well Capitalized” thresholds.
- CET1 ratio at 13.24%, leverage ratio at 9.61%.
Other Noteworthy Items
- Investment Impact: \$9 million fair value loss on Figure Technology investment in Q1 2026, compared to a \$9 million gain in Q4 2025 (total quarterly swing \$18 million).
- Non-Interest Income: \$55 million, down \$35 million (39%) from Q4 2025 and \$25 million (31%) from Q1 2025; adjusted non-interest income was \$64 million, down \$17 million (21%) excluding Figure Investment impact.
- Regulatory Developments: Upgrades by Fitch and Moody’s to investment grade, reflecting improved creditworthiness and potentially lowering future funding costs.
- Conference Call: Scheduled April 24, 2026, 8:00 a.m. ET; replay available until April 28, 2026; webcast archived until May 22, 2026.
- Recent Strategic Actions: \$1.05 billion capital raise completed March 2024; reverse stock split in July 2024; sale of mortgage servicing, origination, and warehouse business in 2024.
Price Sensitive and Shareholder Highlights
- Second consecutive quarter of profitability after periods of loss is a significant turnaround, likely to positively affect investor sentiment and share price.
- Strong capital position (CET1 above peers) and upgrades to investment grade may improve access to capital and reduce borrowing costs.
- Expense reductions and improved asset quality could support future profitability and dividend potential.
- Growth in strategic lending areas signals management’s focus on higher-margin, relationship banking, supporting sustainable growth.
- Resolution of credit issues (decline in non-accrual and criticized loans) addresses prior concerns about asset quality.
- Recent corporate actions (capital raise, reverse split, sale of mortgage businesses) may impact share value and capital structure.
- Material swings in investment valuation (Figure Technology) could create earnings volatility.
- Regulatory improvements and successful integration of prior acquisitions (Signature Bank, Flagstar Bancorp) support a more stable outlook.
Forward-Looking Statements and Risks
The Bank’s management highlighted progress in executing its strategic plan but cautioned about risks, including economic conditions, interest rates, deposit flows, asset quality, regulatory changes, and integration of past acquisitions. Forward-looking statements are subject to change and actual outcomes may differ materially from expectations.
Investor/Media Contact
Salvatore J. DiMartino (516) 683-4286
Disclaimer
This article is based on Flagstar Bank’s Q1 2026 earnings release and associated SEC filings. It contains forward-looking statements subject to risks and uncertainties. Actual results may differ materially. Investors are encouraged to review the full financial statements and risk disclosures, and to consult with their financial advisors before making investment decisions. This article does not constitute investment advice.