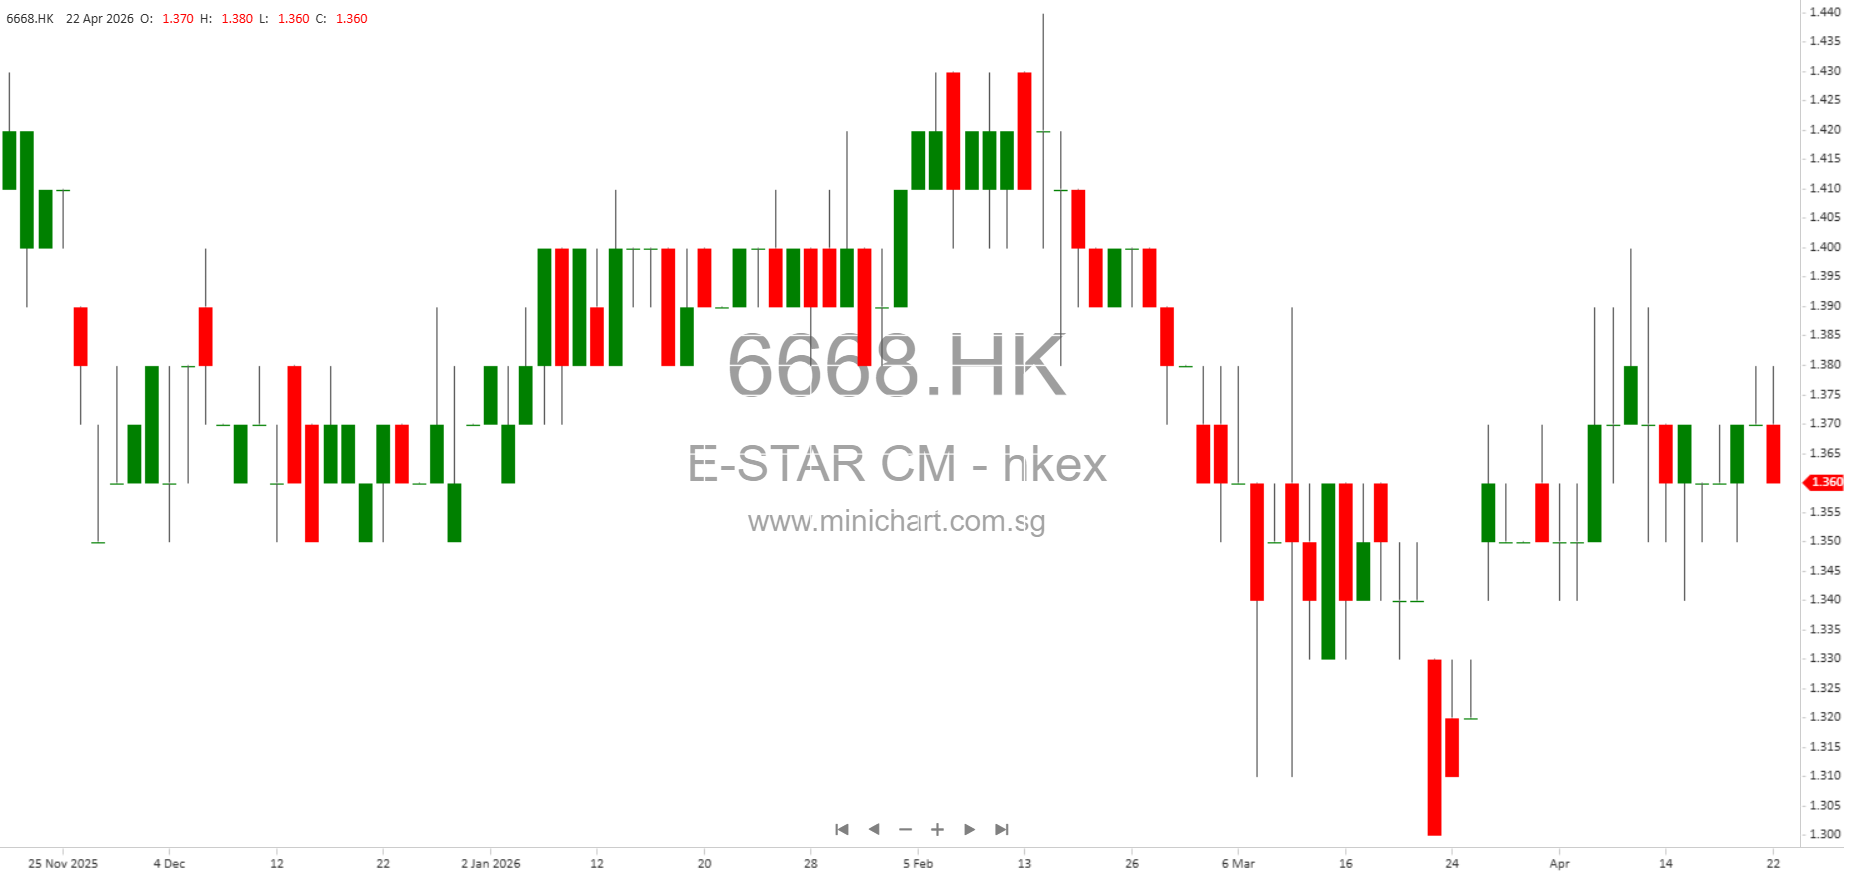
E-Star Commercial Management Unveils 2025 ESG Report: Key Developments and Shareholder Implications
E-Star Commercial Management Company Limited has published its 2025 Environmental, Social and Governance (ESG) Report, reflecting a comprehensive overview of its sustainability initiatives, operational performance, and strategic goals. As the first purely commercial operator listed on the Main Board of HKEX, E-Star is reinforcing its position in the Greater Bay Area, with significant implications for investors and stakeholders.
Key Highlights for Investors
- Record-Setting Business Performance:
- Contracted properties for FY2025 reached 52, covering 2.5 million m2 gross floor area (GFA).
- Operating properties totaled 27, with 1.6 million m2 GFA.
- Total revenue for FY2025 was RMB 582.9 million, with the Greater Bay Area contributing 75.9% of revenue, demonstrating E-Star’s regional dominance and continued strategic expansion into the Yangtze River Delta and other cities.
- Industry Recognition & Awards:
- Secured numerous industry accolades, including:
- 2025 Top 10 Commercial Real Estate Operation Enterprises in China (China Index Academy)
- 2025 Excellent Service Enterprise (Wanshang Club)
- 2025 CCFA Golden Lily Best Marketing Innovation Practice Case of Shopping Centers (CCFA)
- 2025 Top 100 Retail Real Estate Enterprises with Comprehensive Strength (Winshang.com)
- Such awards bolster E-Star’s brand reputation and may improve its competitive position, supporting future revenue and valuation growth.
- Secured numerous industry accolades, including:
- Board Commitment to ESG & Governance:
- The Board takes full responsibility for ESG oversight and strategy, with a multi-tiered management system and regular updates.
- Targets for greenhouse gas (GHG) emissions, waste, energy, and water use were reviewed and confirmed as implemented for 2025.
- No major legal or regulatory violations detected in 2025, ensuring business continuity and minimizing compliance risks.
Material Developments with Potential Price Sensitivity
1. Significant Reduction in GHG Emissions
- Direct GHG emissions (Scope 1) dropped sharply from 654.59 tCO2e in 2024 to 502.06 tCO2e in 2025, mainly due to the disposal of all company vehicles. This demonstrates management’s commitment to carbon reduction and may reduce future regulatory or carbon tax risks.
- Total GHG emissions (Scope 1 & 2) were 100,649.70 tCO2e, with intensity at 0.17 tCO2e/thousand RMB revenue.
- The group achieved 100% LED lighting coverage, completing energy-efficiency upgrades across all projects.
2. Technology-Led Operational Transformation
- Deployed a “Shopping Mall Daily Energy Consumption Control Platform” leveraging AI and Feishu for real-time energy and water management, reducing air conditioning energy consumption by 1.42 million kWh and detecting 1,800 tonnes of hidden water leakage.
- Digital tools and platforms have redefined management processes, improving operational efficiency, data-driven decision-making, and customer engagement. These initiatives may drive future margin expansion and cost savings.
3. Enhanced Customer and Member Ecosystem
- Member sales increased by 12% YoY, with a 19% rise in total membership and 28% growth in Silver Card and above members.
- Repurchase rates for members reached 46%, with high-end member repurchase rates at 56%.
- Member sales now account for over 31% of total sales, with active consumer numbers up 35% YoY—a strong indicator of customer loyalty and recurring revenue potential.
4. Zero Major Compliance Incident and Robust Corporate Culture
- No bribery, extortion, fraud, or money laundering cases reported in 2025.
- Integrity training for new employees achieved 100% coverage.
- Comprehensive internal controls and annual conflict of interest declarations further reduce operational and reputational risks.
5. Supply Chain and Community Investment
- Strict supplier selection criteria with an emphasis on environmental and social responsibility.
- Significant investment in community welfare: RMB 860,100 invested, 1,403 employees participated in public welfare, with 176 hours of activities, strengthening E-Star’s social license to operate and brand image.
Other Noteworthy Details for Shareholders
- Employee turnover rate at 25.93% in 2025, with standardized recruitment and career development processes in place to ensure talent retention and development.
- Comprehensive incentive programs, including share options, restricted share units, and share awards align management interests with shareholders and support long-term value creation.
- No major product or service-related complaints, zero safety incidents, and 100% resolution of customer complaints, indicating high operational standards and customer satisfaction.
Strategic Outlook
- E-Star aims to further expand its scale nationwide, cementing its leadership in the Greater Bay Area while pursuing opportunities in the Yangtze River Delta and other key markets.
- Ongoing digital transformation and ESG leadership are expected to underpin sustainable growth, mitigate climate and regulatory risks, and enhance shareholder value.
Potential Share Price Impact
- The Group’s strong ESG performance, risk management, and operational upgrades position it favorably with institutional investors increasingly focused on sustainability and governance.
- Cost controls and technology upgrades may enhance profitability in future periods.
- The absence of compliance or operational incidents reduces downside risk, while the company’s ability to win industry awards and grow member sales could positively influence market sentiment and valuation multiples.
Disclaimer
This article is based on publicly available information from E-Star Commercial Management Company Limited’s 2025 ESG Report. It is for informational purposes only and does not constitute investment advice. Investors should conduct their own due diligence or consult a financial advisor before making investment decisions. The author and publisher accept no liability for any actions taken based on this report.