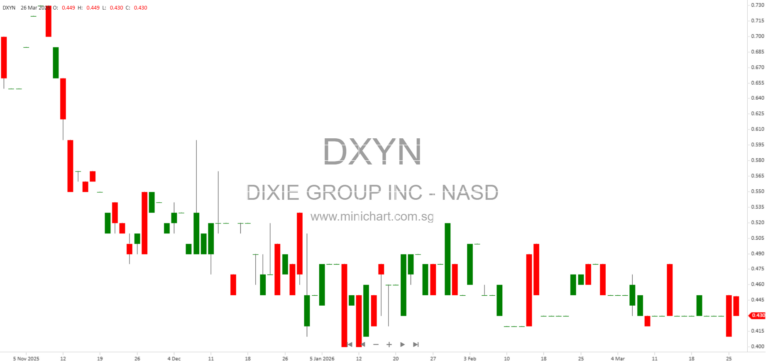
DXYN Stock Price
Last Done:
SGD 9.39
+0.12 (+1.31%)
• Login required for live price
Open: --
High: --
Low: --
Prev Close: --
Login to unlock live stock price, change %, and intraday data.
Login to View
Market: NASD |
Currency:
Address:
📈 DXYN Historical Chart
📊 Statistics
-
Analyst 1 Year Price Target:
-
-
Upside/Downside from Analyst Target:
-
-
Broker Call:
-
-
Dividend Minimum 3 Year Yield:
-
-
EPS Growth Range (1Y):
-
-
Net Income Growth Range (1Y):
-
-
Revenue Growth Range (1Y):
-
-
Upcoming Earnings Date:
-
💰 Dividend History
No dividend history available.
📅 Earnings & EPS History for DXYN
| Date | Reported EPS |
|---|
| 2018-08-02 | 0.01 |
| 2018-05-04 | -0.17 |
| 2018-03-01 | -0.08 |
| 2017-11-09 | -0.03 |
| 2017-08-03 | 0.08 |
| 2017-05-04 | -0.04 |
| 2017-03-06 | -0.18 |
| 2016-10-25 | 0.04 |
| 2016-07-27 | 0.12 |
| 2016-05-03 | -0.25 |
| 2016-02-24 | - |
| 2015-10-29 | 0.03 |
| 2015-07-29 | 0.06 |
| 2015-04-29 | -0.1 |
| 2015-02-18 | 0.02 |
| 2014-10-29 | 0.08 |
| 2014-07-28 | 0.05 |
| 2014-04-30 | -0.17 |
| 2014-02-19 | 0.14 |
| 2013-10-30 | 0.15 |
| 2013-07-31 | 0.13 |
| 2013-05-01 | 0.02 |
| 2013-02-20 | -0.03 |
| 2012-11-09 | 0.02 |
| 2012-08-02 | -0.03 |
📰 Latest Corporate News
March 26, 2026 6:54 am | NASD
The Dixie Group, Inc. Releases March 2026 Investor Presentat...

March 26, 2026 6:49 am | NASD
The Dixie Group Reports Full Year 2025 Financial Results – I...
📰 Related News & Research
🔍 View more Reports
