JBTM Stock Price
Last Done:
SGD 9.39
+0.12 (+1.31%)
• Login required for live price
Open: --
High: --
Low: --
Prev Close: --
Login to unlock live stock price, change %, and intraday data.
Login to View
Market: NYSE |
Currency:
Address:
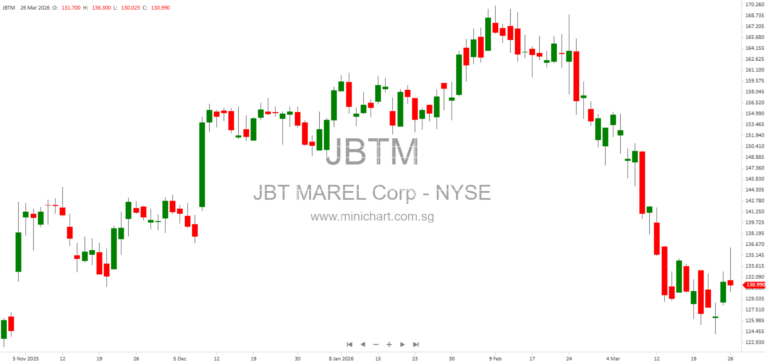
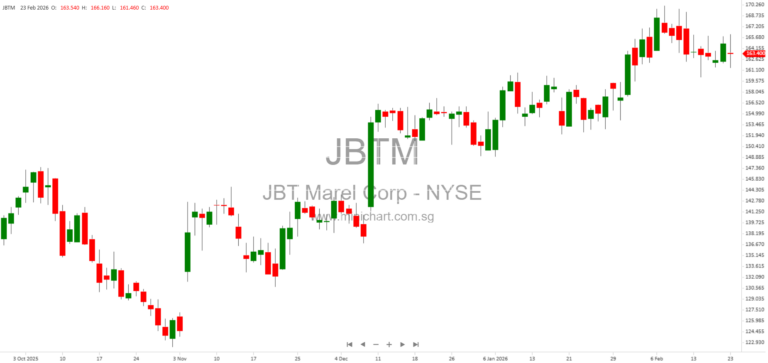
📈 JBTM Historical Chart
📊 Statistics
-
Analyst 1 Year Price Target:
$183.00
-
Upside/Downside from Analyst Target:
18.65%
-
Broker Call:
10
-
Dividend Minimum 3 Year Yield:
0.00%
-
EPS Growth Range (1Y):
<0%
-
Net Income Growth Range (1Y):
<0%
-
Revenue Growth Range (1Y):
100-200%
-
Upcoming Earnings Date:
-
💰 Dividend History
No dividend history available.
📅 Earnings & EPS History for JBTM
| Date | Reported EPS |
|---|
| 2025-10-21 | - |
| 2025-08-04 | 1.49 |
| 2025-05-05 | 0.97 |
| 2025-02-24 | -0.22 |
| 2024-10-22 | 1.5 |
| 2024-07-30 | 1.05 |
| 2024-05-01 | 0.85 |
| 2024-02-20 | 1.4 |
| 2023-10-24 | 1.11 |
| 2023-08-01 | 0.97 |
| 2023-04-25 | 0.94 |
| 2023-02-21 | 1.49 |
| 2022-10-26 | 1.27 |
| 2022-07-27 | 1.13 |
| 2022-04-26 | 0.87 |
| 2022-02-22 | 0.92 |
| 2021-10-27 | 1.02 |
| 2021-07-27 | 1.19 |
| 2021-04-26 | 0.9 |
| 2021-02-22 | 1.02 |
| 2020-10-27 | 0.83 |
| 2020-07-27 | 1.09 |
| 2020-04-29 | 1.01 |
| 2020-02-19 | 1.5 |
| 2019-10-28 | 1.28 |
📰 Latest Corporate News
March 26, 2026 8:46 am | NYSE
JBT Marel 2026 Investor Day: Key Insights for Shareholders
...
February 23, 2026 4:32 pm | NYSE
JBT Marel Corporation Reports Q4 and Full-Year 2025 Results,...
📰 Related News & Research
No related articles found for "jbtm".
