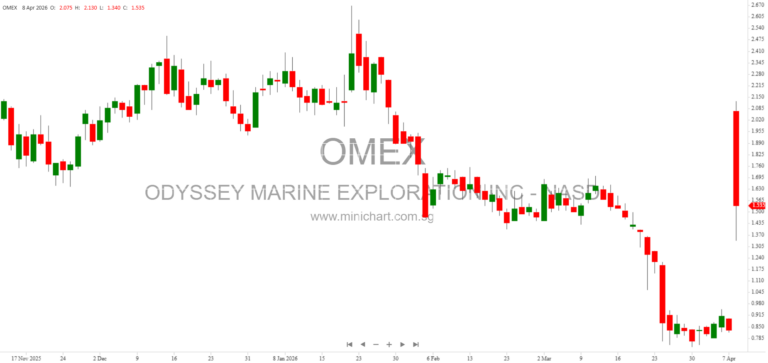
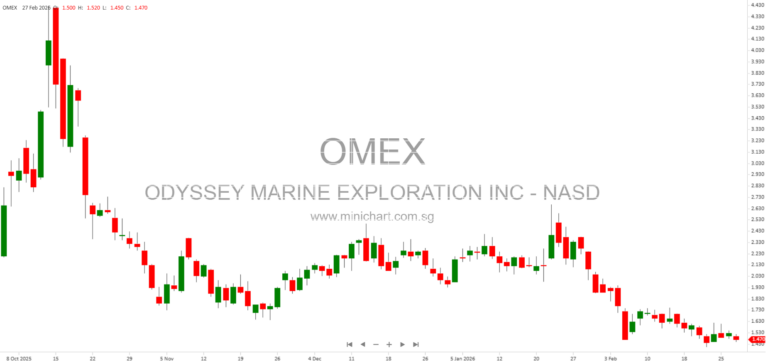
Odyssey Marine Exploration, Inc. Stock Price
Last Done:
SGD 9.39
+0.12 (+1.31%)
• Login required for live price
Open: --
High: --
Low: --
Prev Close: --
Login to unlock live stock price, change %, and intraday data.
Login to View
Market: NASD |
Currency: USD
Address: 205 South Hoover Boulevard
Odyssey Marine Exploration, Inc., together with its subsidiaries, discovers, validates, and develops seafloor mineral resources. It explores for phosphate and gold. The company provides specialized mineral exploration, project development, and marine services to clients. Odyssey Marine Exploration, Inc. is headquartered in Tampa, Florida.
📈 Odyssey Marine Exploration, Inc. Historical Chart
📊 Statistics
-
Analyst 1 Year Price Target:
-
-
Upside/Downside from Analyst Target:
-
-
Broker Call:
-
-
Dividend Minimum 3 Year Yield:
0.00%
-
EPS Growth Range (1Y):
<0%
-
Net Income Growth Range (1Y):
<0%
-
Revenue Growth Range (1Y):
<0%
-
Upcoming Earnings Date:
2026-05-13
💰 Dividend History
No dividend history available.
📅 Earnings & EPS History for Odyssey Marine Exploration, Inc.
| Date | Reported EPS |
|---|
| 2026-05-12 (estimated upcoming) | - |
| 2016-05-12 | 0.01 |
| 2016-03-30 | -0.45 |
| 2015-11-05 | -0.6 |
| 2015-08-07 | -0.84 |
| 2015-05-11 | -1.32 |
| 2015-03-16 | -0.72 |
| 2014-11-10 | -1.08 |
| 2014-08-11 | -0.5 |
| 2014-05-12 | -1.44 |
| 2014-03-11 | 1.56 |
| 2013-11-12 | 0.03 |
| 2013-08-08 | -1.68 |
| 2013-05-10 | -1.44 |
| 2013-03-12 | -0.12 |
| 2012-11-08 | -0.12 |
| 2012-08-01 | -2.03 |
| 2012-05-04 | -0.88 |
| 2012-03-12 | -0.5 |
| 2011-11-09 | -1.14 |
| 2011-08-08 | -8.4 |
| 2011-05-09 | -1.08 |
| 2011-02-28 | -2.04 |
| 2010-11-04 | -0.24 |
| 2010-08-09 | -0.6 |
📰 Latest Corporate News
April 8, 2026 9:09 am | NASD
American Ocean Minerals and Odyssey Marine Exploration Annou...
February 27, 2026 5:29 pm | NASD
Odyssey Marine Exploration (OMEX) Enters Amended and Restate...
📰 Related News & Research
🔍 View more Reports
