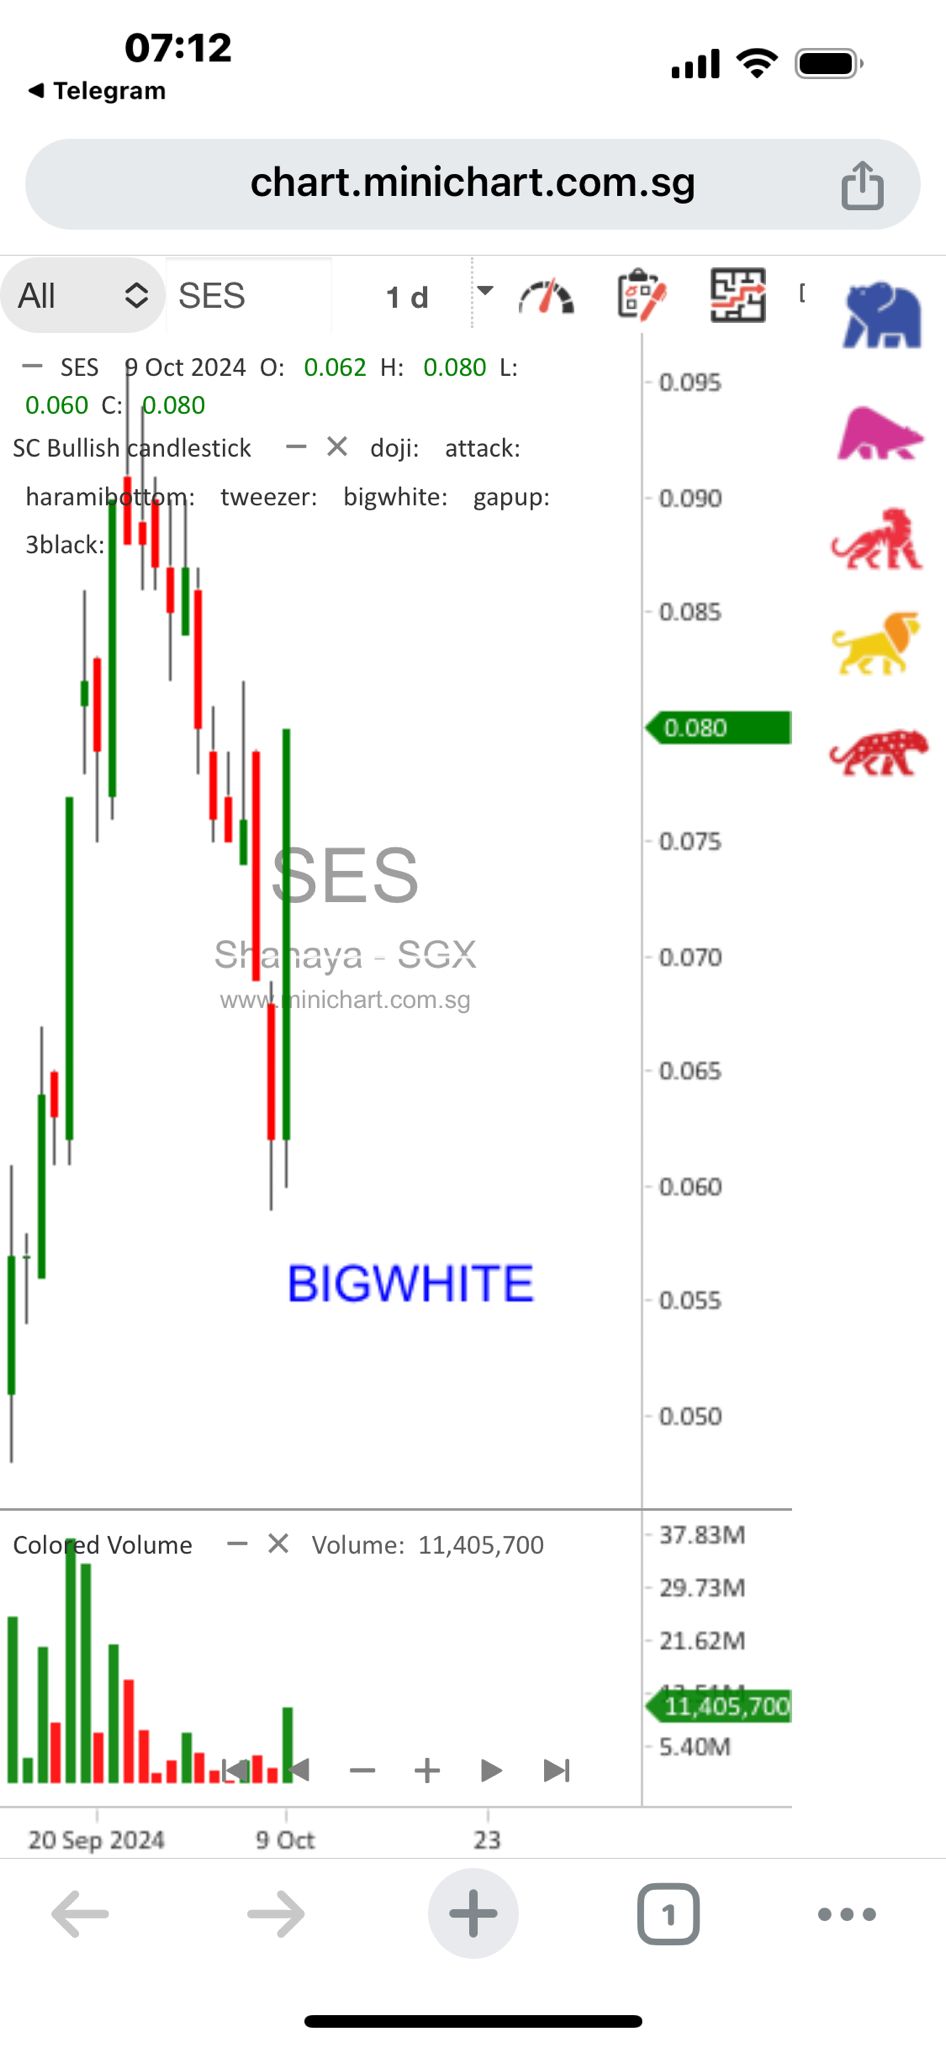
Shanaya is currently trading at $0.08, and recent chart patterns have displayed a prominent white bar, which may indicate a potential bullish trend. This chart signal suggests that the stock could have more room for upward movement. Two weeks ago, Shanaya reached a peak price of $0.095, representing a 20% increase from its current level. If the stock revisits this recent high, investors could see a notable gain, making it worth monitoring for further price action. Keep an eye on any additional technical indicators that may confirm this upward momentum. Thank you