OceanFirst Financial Corp. Announces Q2 2026 Results: Strategic Flushing Acquisition, Balance Sheet Shift, and Non-Core Expense Impact
Key Financial Highlights
- Net Loss: OceanFirst reported a net loss of \$3.0 million, or \$0.04 per diluted share for Q2 2026. This compares to net income of \$16.2 million (\$0.28 per share) in Q2 2025 and \$20.5 million (\$0.36 per share) in Q1 2026.
- Six-Month Results: Net income for the six months ended June 30, 2026 was \$17.5 million (\$0.27 per share), significantly lower than \$36.7 million (\$0.63 per share) for the same period last year.
- Core Earnings: Core earnings (excluding non-core items) were robust at \$30.5 million (\$0.43 per share) for the quarter and \$54.9 million (\$0.86 per share) for the six months, up from \$17.7 million (\$0.31 per share) and \$38.0 million (\$0.66 per share) respectively in 2025. Core PTPP (Pre-Tax Pre-Provision) earnings were \$44.5 million (\$0.63 per share) and \$78.9 million (\$1.24 per share) for the quarter and six months, also higher than last year.
- Efficiency Ratio: GAAP efficiency ratio spiked to 98.88% due to merger expenses, but core efficiency ratio improved to 66.20% (Q2 2026), indicating strong underlying operating performance.
- Net Interest Margin (NIM): Expanded to 3.05% from 2.91% a year ago, driven by repricing, new origination, and the Flushing acquisition.
- Dividend: 118th consecutive quarterly dividend declared, \$0.20 per share, payable August 21, 2026.
Strategic Developments and Shareholder-Relevant Events
Flushing Financial Acquisition – Major Expansion and Balance Sheet Shift
- Completed acquisition of Flushing Financial Corporation on June 1, 2026.
- Flushing added \$8.69 billion in assets, \$6.19 billion in loans, and \$7.44 billion in deposits, as well as 30 retail branches across NYC and Long Island.
- OceanFirst sold \$1.3 billion of multifamily loans from the Flushing portfolio (price: 92.25%) and reinvested \$1.2 billion into highly liquid, investment grade securities.
- This repositioning reduced commercial real estate (CRE) concentration by ~50 percentage points to 381%, and improved liquidity (on-hand liquidity at 11.5% of assets; loan-to-deposit ratio fell to 91.60%).
- Allowance for credit losses increased to 1.29% of loans (vs. 0.76% prior), largely due to new reserves for Flushing-acquired loans.
- Integration of Flushing operations is expected to be completed in Q3 2026; operational synergies expected to lower expenses going forward.
- CEO Christopher D. Maher emphasized strategic focus on core relationships and strong liquidity for long-term growth.
Organic Growth and Deposit Trends
- Commercial loans grew by \$154 million (2%); non-interest bearing deposits up \$101 million (6%).
- Premier Banking teams delivered \$150 million in deposit growth.
- Excluding Flushing, deposit declines attributed to seasonal government flows.
- Time deposits up \$1.74 billion; retail time deposits grew by \$1.41 billion, brokered time deposits by \$276 million.
Non-Core Expenses Impact Earnings
- Q2 included \$42.8 million in non-recurring, merger-related expenses for the Flushing deal (\$33.6 million net of tax, \$0.48 per share).
- Operating expenses surged to \$129.9 million (from \$71.5 million in Q2 2025), mostly due to merger costs and Flushing acquisition (\$14.8 million additional expense).
- Excluding merger and restructuring charges, expense increase was mainly due to commercial banking hires and inflation.
Asset Quality and Credit Losses
- Allowance for loan losses increased to 1.29% of loans, driven by Flushing portfolio.
- Non-performing loans increased to \$108.2 million (0.67% of loans), mostly due to Flushing-acquired loans and one large commercial relationship.
- Net loan charge-offs were \$1.5 million for the quarter (0.05% annualized), lower than last year on a percentage basis.
- PCD (Purchased with Credit Deterioration) loans from Flushing totaled \$750.4 million; asset quality excluding PCD loans remains strong (non-performing loan coverage ratio: 388%).
Capital and Liquidity
- Stockholders’ equity increased to \$2.41 billion, up from \$1.66 billion, driven by Flushing acquisition (\$535.6 million equity added) and a \$225 million strategic investment by Warburg Pincus affiliates (in exchange for 9.6 million common shares, 1.8 million NVCE shares, and warrants for 11.4 million NVCE shares).
- Tangible common equity rose by \$654.6 million to \$1.79 billion; tangible common equity to tangible assets decreased slightly to 7.91% (from 8.09%).
- Book value per common share declined to \$24.50 (from \$28.97); tangible book value per common share fell to \$18.19 (from \$19.79).
- Capital ratios remain above “well-capitalized” regulatory standards (estimated CET1 ratio: 10.7%).
- Share repurchases: 376,277 shares (\$7.1 million) repurchased in H1 2026; 3.2 million shares remain available under repurchase programs.
- OceanFirst donated 273,973 shares (\$5.0 million) to its foundation using treasury stock.
Other Operating Metrics
- Net Interest Income: Rose to \$120.7 million from \$87.6 million in Q2 2025, aided by Flushing acquisition (\$19.1 million incremental interest income).
- Average Yield: Interest-earning assets yielded 5.29% in Q2 2026 (up from 5.14%); average cost of interest-bearing liabilities decreased to 2.74% (from 2.77%).
- Loan Growth: Total loans increased to \$16.3 billion (from \$11.0 billion at year-end), mostly attributed to Flushing.
- Deposits: Total deposits rose to \$17.8 billion (from \$10.96 billion); non-interest bearing deposits at \$2.84 billion.
- Branch Network: OceanFirst now operates 71 full-service branches, up from 41 last quarter.
Potential Share Price Sensitivities
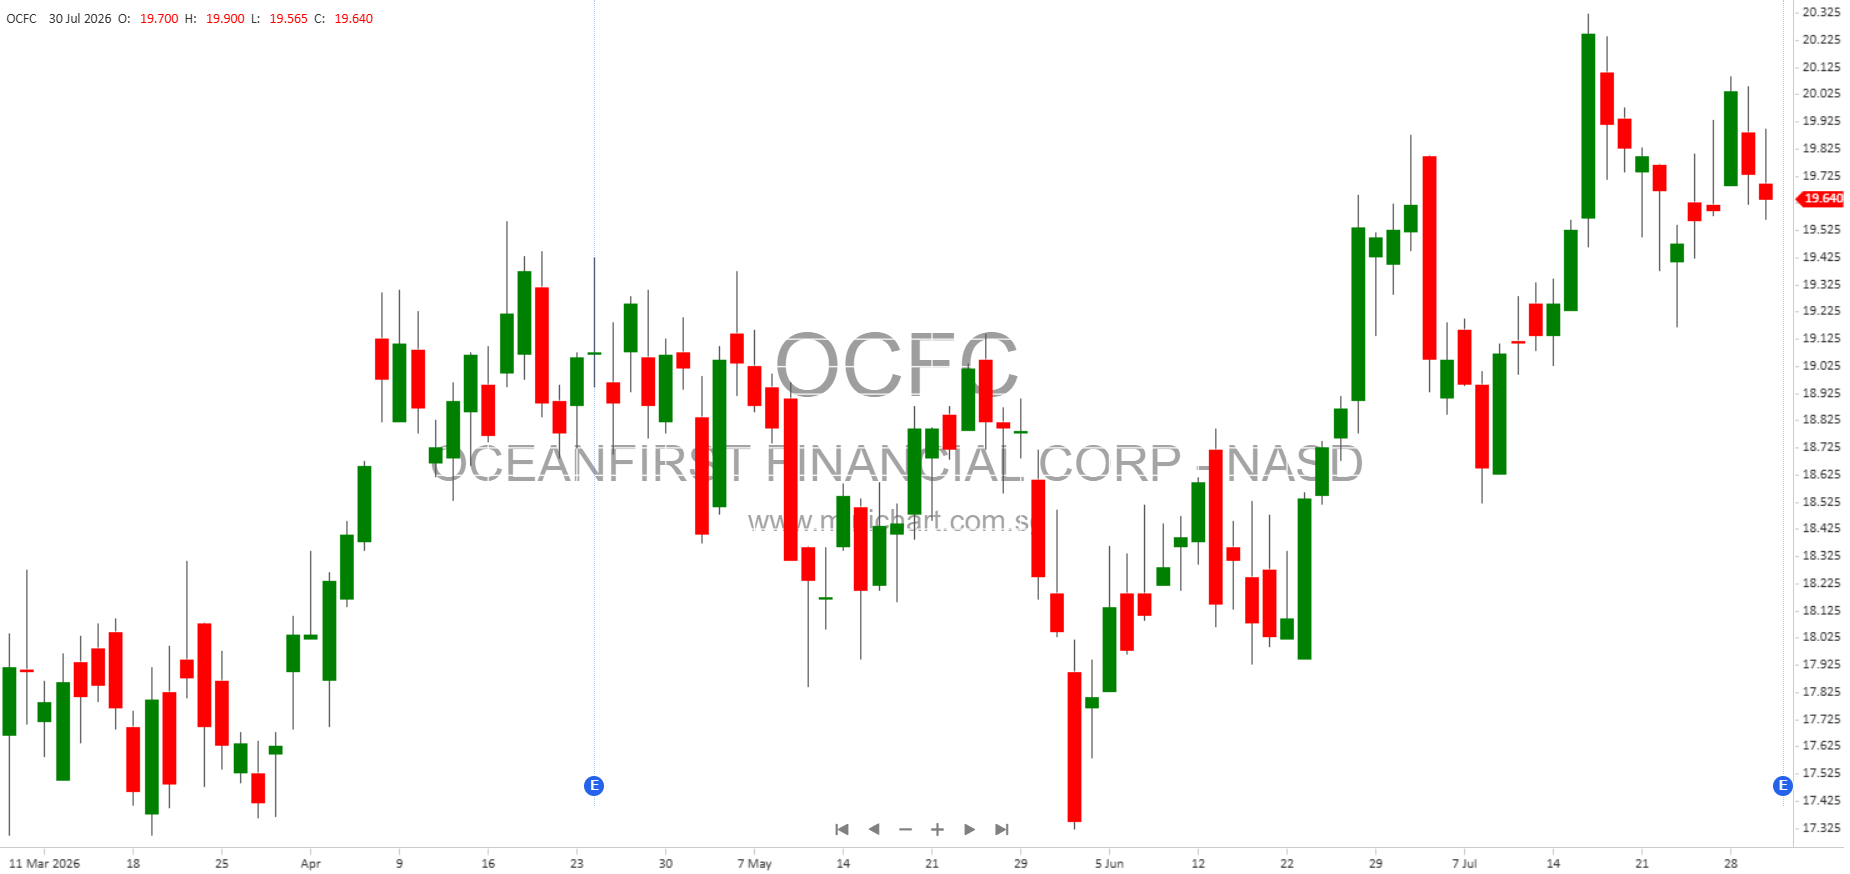
- Merger Execution and Expense Impact: The large, non-recurring merger expenses resulted in a net loss for the quarter, but core earnings were strong. Successful integration and cost reduction from Flushing will be key for future profitability.
- Strategic Capital Injection: The Warburg Pincus investment is a significant event, increasing capital and share count, and may influence valuation and future growth opportunities.
- Balance Sheet Repositioning: The sale of rent-regulated multifamily loans and reinvestment into liquid securities reduces CRE risk and enhances liquidity, positioning OceanFirst for stability and future expansion.
- Asset Quality Changes: The increase in non-performing loans and allowance for credit losses, largely due to Flushing, may raise investor concerns about credit risk, though coverage ratios remain strong.
- Dividend Continuity: Continued dividend payments signal confidence in core earnings and capital strength.
- Share Repurchases and Foundation Donation: Repurchase activity and share donation to the foundation are notable, but the dilution from new shares issued in the Warburg investment may offset repurchase effects.
- Efficiency Ratios: GAAP efficiency ratio is high due to merger expenses, but core efficiency ratio indicates strong operational leverage post-acquisition.
Forward-Looking Statements and Risks
Management highlighted risks related to interest rates, inflation, macroeconomic conditions, real estate values, regulatory changes, cyber threats, and integration risks post-merger. Shareholders should monitor progress on Flushing integration, asset quality developments, and expense trends closely.
Conference Call
OceanFirst will host an earnings call on July 31, 2026 at 11:00 a.m. ET. Investors can dial (833) 461-5787 (meeting ID: 387420595) or access the webcast at https://ir.oceanfirst.com/.
About OceanFirst
OceanFirst Bank N.A., founded in 1902, is a \$23.3 billion regional bank serving business and retail customers across New Jersey, New York, Long Island, and the metropolitan corridor from Massachusetts through Virginia. Services include commercial and residential financing, treasury management, trust and asset management, and deposit services.
Disclaimer
This article is for informational purposes only and does not constitute investment advice. Forward-looking statements are subject to risks and uncertainties. Investors should review the company’s SEC filings and consult with financial advisors prior to making any investment decisions. OceanFirst’s actual results may differ materially from those expressed or implied due to various risks and factors described herein and in regulatory filings.