Oxford Square Capital Corp. (OXSQ) Reports Q2 2026 Results: Key Metrics, Distributions, and Outlook
Key Highlights
- Net Asset Value (NAV) per share: \$1.29 as of June 30, 2026, down from \$1.32 on March 31, 2026, and a significant year-over-year drop from \$2.06 on June 30, 2025.
- Net Investment Income (NII): \$5.1 million or \$0.05 per share for Q2 2026, steady compared to \$0.05 per share in Q1 2026, but lower than \$0.08 per share in Q2 2025.
- Total Investment Income: \$9.4 million for the quarter, up from \$8.9 million in Q1 2026, but slightly down from \$9.5 million in Q2 2025.
- Total Expenses: \$4.3 million for Q2 2026, a decrease from \$4.8 million in Q1, but higher than \$4.0 million in Q2 2025.
- Net Increase in Net Assets from Operations: \$4.0 million for the quarter, compared to \$4.4 million in Q2 2025.
- Distributions Declared: \$0.035 per share for each of October, November, and December 2026, in line with recent distribution levels.
- Common Stock Issuance: 11.3 million shares issued in Q2 2026 via at-the-market offering, raising net proceeds of \$17.8 million; total shares outstanding now 105.1 million.
- Investment Activity: \$19.9 million in new investments and \$0.5 million in repayments during Q2. No portfolio sales in the quarter.
- Credit Quality: Weighted average credit rating improved to 2.1 (fair value basis) from 2.2 in Q1.
- Non-Accrual Investments: \$6.9 million (fair value) of preferred equity investments in one portfolio company on non-accrual status.
Detailed Financial Review
Distributions Update
The Board of Directors has declared monthly distributions of \$0.035 per share for October, November, and December 2026. These distributions continue the company’s policy of steady monthly payments, but investors should note that the NAV per share is now below the annualized distribution rate, which may raise questions about long-term sustainability if earnings do not recover.
Net Asset Value (NAV) and Shareholder Equity
NAV per share declined slightly to \$1.29 as of June 30, 2026 (from \$1.32 in Q1 2026), and significantly from \$2.06 a year ago. Total net assets stand at \$135.0 million, down from \$145.4 million at year-end 2025. The persistent decline in NAV is a key concern for shareholders, as it reflects both realized losses and the impact of distributions exceeding earnings.
Earnings and Income
- NII held steady at \$0.05 per share, with total investment income of \$9.4 million for the quarter. This income was composed of \$5.4 million from debt investments, \$3.5 million from CLO equity investments, and \$0.5 million from other income.
- Expenses decreased quarter-over-quarter, but interest expense has climbed year-over-year, largely due to higher debt levels and increased interest rates.
- Net realized losses were substantial at \$5.2 million for the quarter, only partially offset by \$4.1 million in unrealized appreciation. For the six months ended June 30, 2026, net realized losses totaled a significant \$36.0 million.
Investment Portfolio and Yields
- Weighted average yield of debt investments: 14.9% (up from 14.7% in Q1).
- Weighted average effective yield of CLO equity investments: 8.1% (up from 7.3%).
- Weighted average cash distribution yield of CLO equity investments: 12.4% (down from 13.6%).
- Senior secured note investments yield remains stable at 8.0%.
- Non-accrual investments (i.e., investments not generating income) remain a risk, with \$6.9 million at fair value on non-accrual status as of quarter end.
Capital Structure and Liquidity
- Notes Payable: \$152.1 million in senior unsecured notes outstanding.
- Cash and Equivalents: \$34.6 million at quarter end.
- Significant Equity Issuance: 11.3 million shares issued in Q2, raising \$17.8 million in net proceeds. The increase in share count dilutes existing shareholders, although it does bolster liquidity.
Shareholder and Price-Sensitive Considerations
- Persistent Decline in NAV: The ongoing decrease in NAV per share—even as distributions are maintained—may put downward pressure on the share price, especially if investors become concerned about the sustainability of payouts.
- Substantial Realized Losses: The large realized losses (\$5.2 million in Q2; \$36.0 million year-to-date) are a red flag, signaling potential credit issues or unfavorable market conditions affecting asset values.
- Equity Issuance and Dilution: The recent at-the-market offering has increased the share count by over 13%, with proceeds used presumably to support liquidity and investment activity. However, this may dilute per-share returns unless new investments outperform.
- Non-Accrual Status: \$6.9 million in non-accrual investments highlight credit quality concerns within the portfolio.
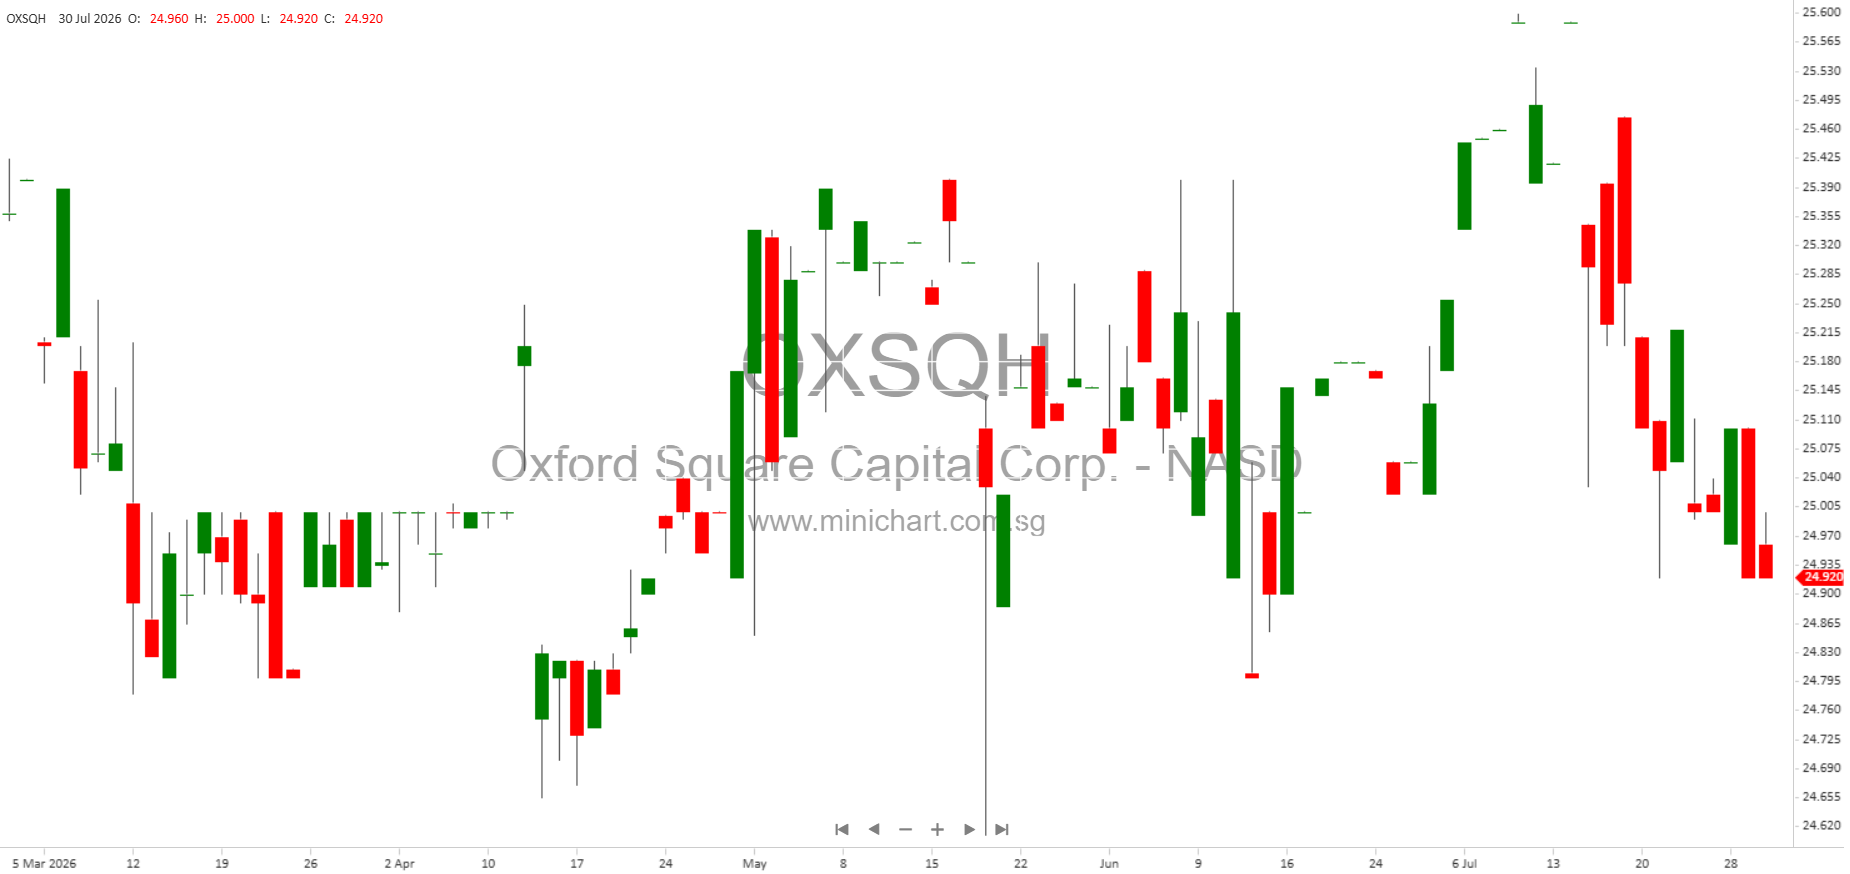
- Market Value Under Pressure: The market value per share dropped from \$1.77 to \$1.32 during the quarter, a nearly 25% decline, reflecting investor concerns and possibly aligning with the NAV trend.
- Expense Ratios: Expense ratio (including interest) spiked to 14.39% for the quarter, up from 10.78% a year ago, which could impact long-term returns.
- Conference Call and Additional Materials: Management is conducting a conference call and has made detailed presentations available, signaling transparency and willingness to engage with investors.
Additional Information and Forward-Looking Statements
Oxford Square Capital Corp. remains focused on investments in syndicated bank loans and CLO vehicles. Management warns that forward-looking statements are subject to uncertainty and actual results may differ due to market and credit conditions.
Conclusion
The Q2 2026 report from Oxford Square Capital Corp. is a mixed bag for investors. While investment income and distributions remain steady, the ongoing decline in NAV, sizeable realized losses, and increased dilution from share issuances are key concerns that could continue to weigh on the stock price. Credit quality issues, as evidenced by non-accrual investments, and rising expense ratios also warrant close monitoring. Investors should carefully consider these factors, particularly the sustainability of distributions relative to earnings and NAV trends.
Disclaimer: This article is for informational purposes only and does not constitute investment advice. Investors should conduct their own due diligence and consult with a qualified financial advisor before making any investment decisions. Past performance is not indicative of future results, and forward-looking statements in this article are subject to risks and uncertainties that may cause actual results to differ materially.