CSW Industrials, Inc. Reports Strong Q1 2027 Earnings: Key Insights and Investor Takeaways
Highlights from the Quarterly Report
- CSW Industrials (NYSE: CSW) reported robust results for the quarter ended June 30, 2026.
- Net income for Q1 2027: \$49.78 million, a significant increase compared to \$41.17 million in the prior year’s corresponding quarter.
- Basic earnings per share (EPS): \$3.05, up from \$2.43 in Q1 2026.
- Diluted earnings per share (EPS): \$3.04, up from \$2.43 in Q1 2026.
- Comprehensive income: \$51.28 million, compared to \$42.55 million last year.
- Return of capital to shareholders: The company repurchased \$23.53 million worth of stock during the quarter and paid \$4.91 million in dividends.
- Shares outstanding: As of July 24, 2026, the company had 16,293,487 common shares outstanding.
- Strong equity position: Stockholders’ equity at quarter-end was \$1.07 billion.
- CSW Industrials remains listed on the New York Stock Exchange under ticker CSW.
Financial Details Investors Should Note
- Accelerated Profit Growth: The company’s profit growth outpaced the previous year, with net income rising by over 20%. This is indicative of strong operational execution and possibly increased demand for CSW’s products and services.
- EPS Beats: The jump in both basic and diluted EPS to \$3.05 and \$3.04 respectively suggests not only higher profitability but also efficient capital management. These per-share earnings figures are key benchmarks for institutional and retail investors.
- Comprehensive Income: The increase in comprehensive income, reflecting both net income and other comprehensive gains (notably, foreign currency translation adjustments), demonstrates healthy international operations and limited exposure to adverse currency impacts.
-
Shareholder Returns:
- The company was active in returning value to shareholders, repurchasing over \$23.5 million of its own shares—this can be price sensitive as buybacks reduce the float and often signal management’s confidence in the company’s valuation.
- Dividend payments of approximately \$4.91 million also underscore a commitment to consistent capital returns.
- Share Count and Capital Structure: The company ended the quarter with 16.29 million shares outstanding. Significant buybacks and limited equity issuance may impact EPS positively in subsequent quarters and could influence future dividend policy.
-
Balance Sheet Strength:
- Stockholders’ equity of \$1.07 billion and total assets of over \$2.33 billion provide a solid foundation for future growth, M&A opportunities, or resilience during macroeconomic headwinds.
- The company has no preferred shares outstanding, simplifying the capital structure and reducing the risk of dilution for common shareholders.
- Regulatory and Reporting Compliance: The company affirms it has filed all required reports and posted all interactive data files as required by the SEC, confirming robust governance and transparency.
Key Items That May Be Price Sensitive
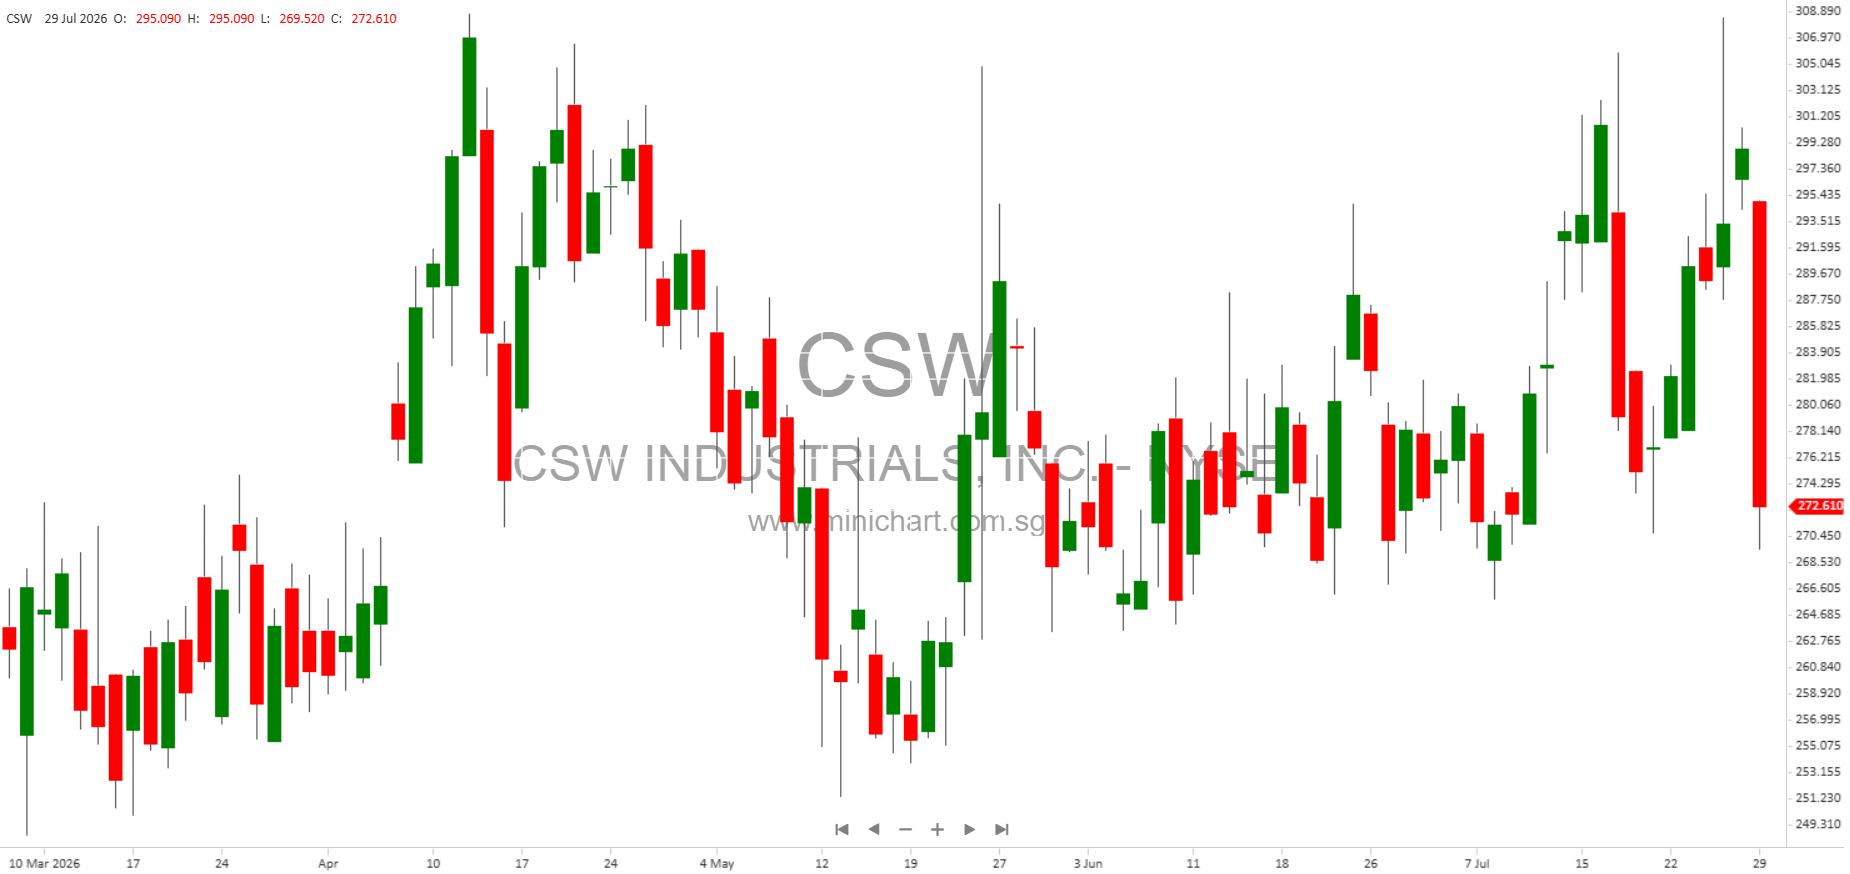
- Share Buybacks: The \$23.53 million spent on repurchasing shares is a substantial outlay and can be interpreted as a bullish signal from management. Buybacks at these levels often lead to positive price reactions in the market.
- EPS Acceleration: The year-on-year jump in EPS will likely be viewed favorably by investors, especially as it comes alongside increased net income and stable or reduced share count.
- Dividend Policy: The ongoing commitment to dividends, even as the company pursues share repurchases, signals strong cash generation and could support further upward momentum in the stock.
Additional Details for Investors
- Share-Based Compensation: The company incurred \$4.09 million in share-based compensation for the quarter, in line with peer practices and reflective of ongoing talent retention strategies.
- Treasury Stock: The value of treasury shares at cost was \$288.9 million at quarter-end, reflecting the cumulative impact of repurchases.
- Foreign Currency Adjustments: The company reported positive foreign currency translation adjustments of \$1.50 million, which helped boost comprehensive income.
- Equity Structure: Common share par value remains at \$0.01, with 17.95 million shares issued and 1.65 million held as treasury stock, clarifying the components of outstanding shares.
Outlook and Considerations
The strong start to FY2027, marked by higher profitability, ongoing share buybacks, and dividend payments, positions CSW Industrials as a potentially attractive investment for shareholders seeking both growth and income. The company’s solid balance sheet and active return of capital signal confidence in the business’s future prospects, although investors should continue to monitor macroeconomic risks and any changes in capital allocation policy.
Disclaimer
This article is for informational purposes only and does not constitute investment advice or a recommendation to buy or sell any securities. Investors should consult their own advisors and review the company’s full SEC filings before making any investment decisions. All financial information is derived from the company’s Q1 2027 Form 10-Q and is unaudited. Past performance does not guarantee future results.