TechnipFMC Reports Strong Q2 2026 Results: Key Highlights and Shareholder Considerations
Financial and Operational Highlights
- Revenue for Q2 2026 stood at \$2.49 billion, demonstrating resilience despite a sequential dip from Q1’s \$2.53 billion.
- Net income reached \$362.7 million, a substantial 39% increase sequentially from Q1’s \$260.5 million, and up 40.7% year-over-year.
- Diluted earnings per share surged to \$0.90 (up from \$0.64 in Q1), marking a 40.6% increase both sequentially and year-on-year.
- Adjusted EBITDA margin reached 21.1%, up from 20.5% in Q1, and up 240 basis points year-on-year.
- Free cash flow in the quarter was \$487.9 million, reflecting robust cash generation.
- Cash and cash equivalents at the end of Q2 totaled \$991.8 million, with net cash at \$589.9 million.
Segment Performance
Subsea Segment
- Adjusted EBITDA: \$577.2 million in Q2 2026.
- Strong margin expansion, reflecting effective cost management and project execution.
Surface Technologies Segment
- Revenue: \$276.2 million, a sequential decrease from \$284.3 million—reflecting ongoing industry challenges.
- Operating profit: \$39.0 million vs \$37.1 million in Q1.
- Adjusted EBITDA margin: 14.1% (down from 16.7% year-over-year).
Shareholder Returns and Capital Allocation
- TechnipFMC repurchased 5.9 million ordinary shares in Q2 for a total consideration of \$420.1 million.
- A dividend payment of \$19.8 million was also made in the quarter.
- Total shareholder distributions in Q2 were \$439.9 million.
Corporate and Other Items
- Corporate expense: \$26.4 million.
- Foreign exchange loss: \$19.3 million.
- Net interest expense: \$3.6 million.
- Income tax provision: \$114.1 million.
- Total depreciation and amortization: \$97.1 million.
2026 Full-Year Financial Guidance (Unchanged)
| Metric | 2026 Guidance |
|---|---|
| Group Revenue | \$9.2 – \$9.6 billion |
| Surface Technologies Revenue | \$1.15 – \$1.3 billion |
| Adjusted EBITDA Margin | 21% – 22% |
| Corporate Expense, Net | \$115 – \$125 million |
| Capital Expenditures | ~\$340 million |
| Free Cash Flow | \$1.3 – \$1.45 billion |
Note: Guidance measures are non-GAAP and exclude charges and credits. No updates were made to previous guidance.
Key Takeaways and Price-Sensitive Information
- TechnipFMC delivered a significant jump in profitability, with net income and earnings per share up over 40% sequentially and year-on-year.
- Robust free cash flow and cash balances provide flexibility for continued shareholder returns and investment.
- Aggressive share buybacks and sustained dividends highlight management’s confidence in future cash flow and commitment to shareholder value.
- Management reaffirmed full-year guidance, signaling confidence in visibility and operational performance through the remainder of 2026.
- No new updates to guidance may be taken as a sign of stability, but investors should watch for macro headwinds such as energy prices and project timing.
Shareholder Considerations
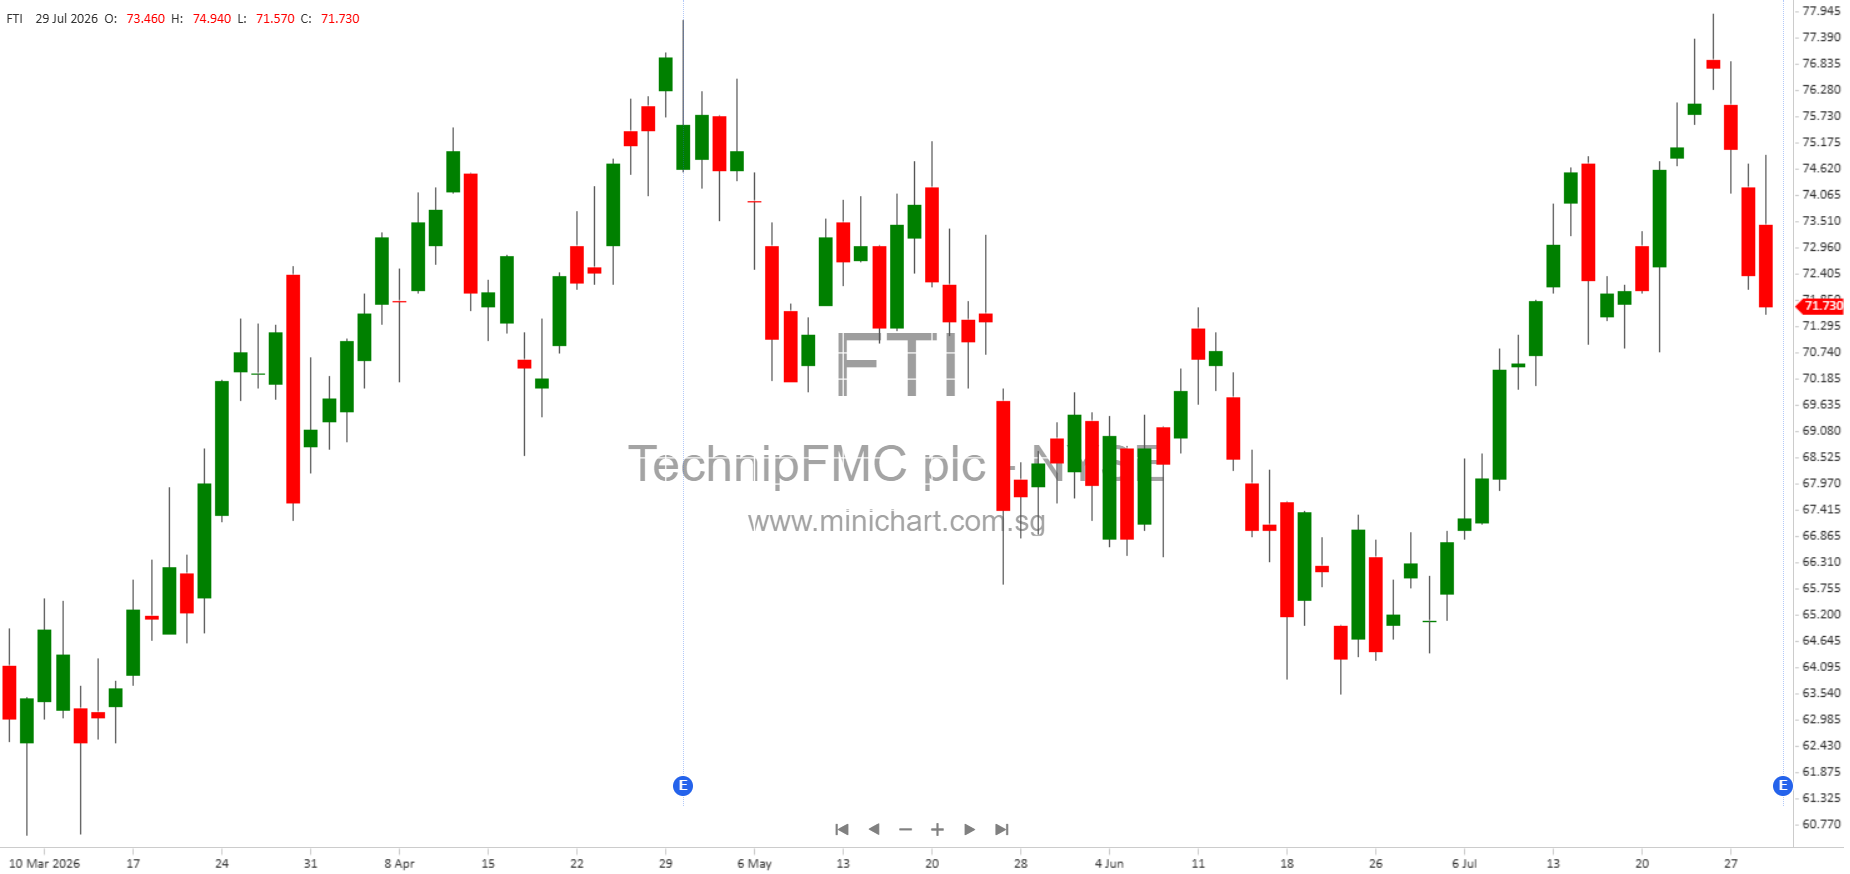
- Share repurchases and dividend payments are price-sensitive, supporting the company’s share price and indicating confidence in future cash flows.
- Consistent free cash flow above \$1.3 billion for the year could allow for further capital returns or strategic investments.
- Investors should monitor any future updates regarding project backlog, commodity price movements, or potential M&A/divestitures, as these could become catalysts for share price movement.
Upcoming Events
- TechnipFMC will host a teleconference on July 30, 2026, to discuss the results. Webcast access and presentation materials are available at www.TechnipFMC.com.
Disclaimer: This article is for informational purposes only and does not constitute financial advice or a recommendation to buy or sell securities. All forward-looking statements are subject to risks and uncertainties, including those discussed in TechnipFMC’s filings with the Securities and Exchange Commission. Actual results may differ materially from those anticipated in any forward-looking statement. Investors are encouraged to review the company’s official filings and consult with their financial advisors before making investment decisions.