Avery Dennison Announces Strong Second Quarter 2026 Results
Robust Sales and Earnings Growth, Raised Guidance for Full Year
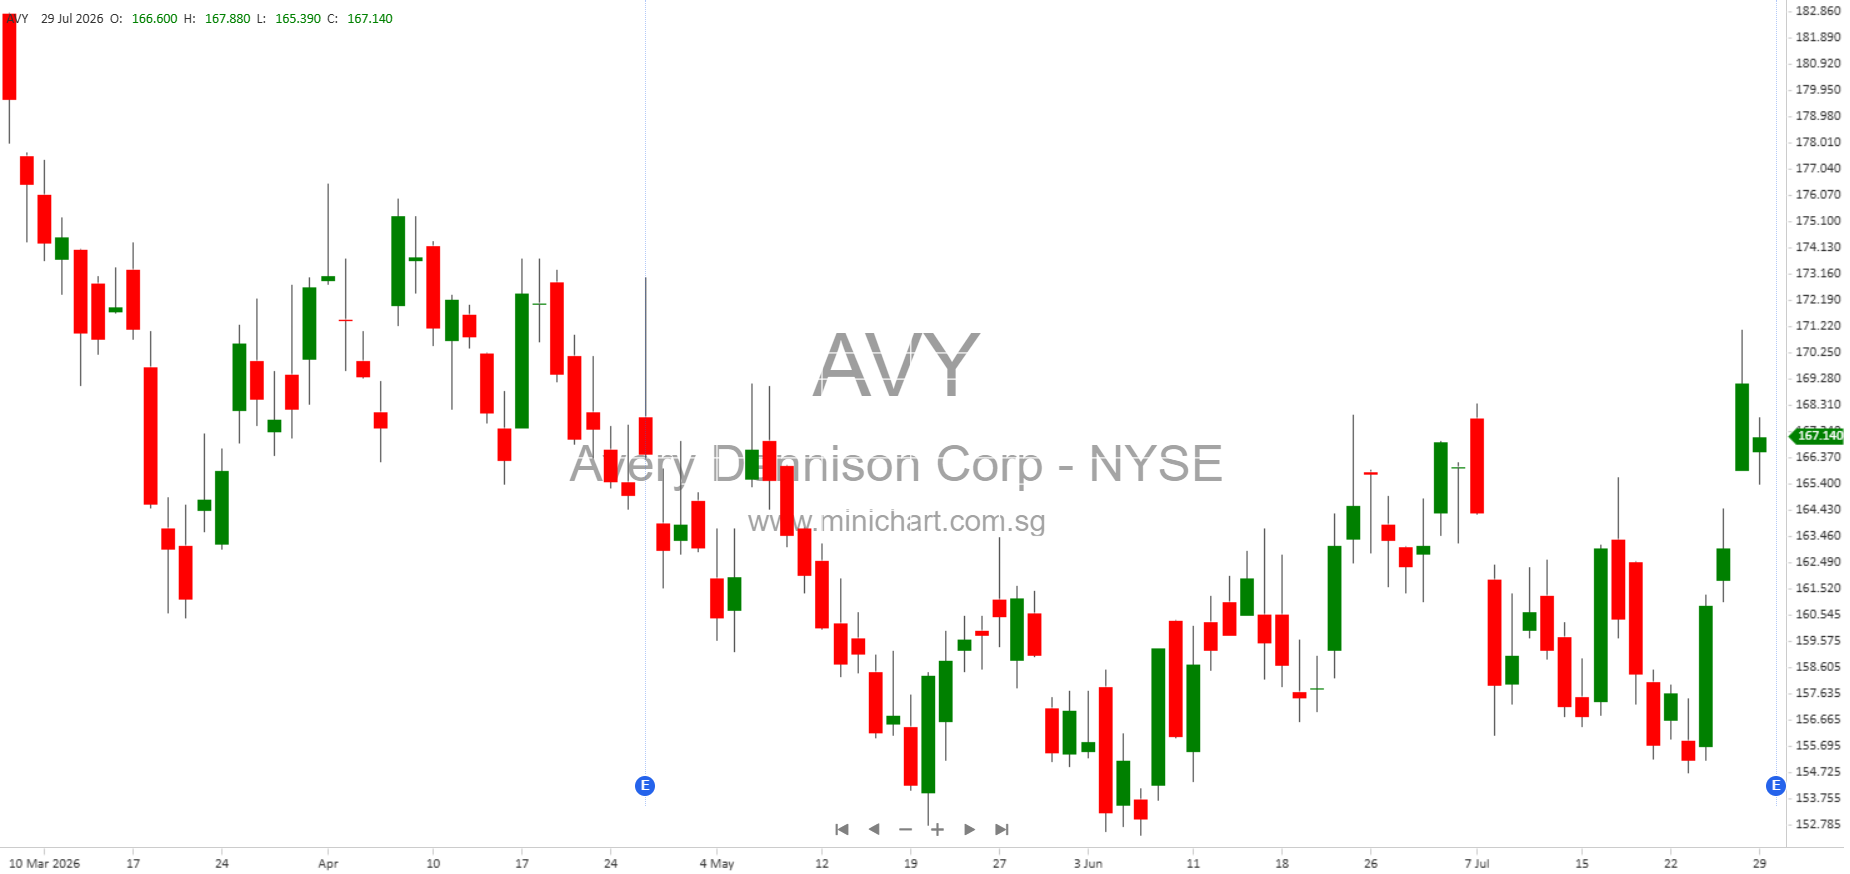
Avery Dennison Corporation (NYSE: AVY), a global leader in materials science and digital identification solutions, has reported a remarkably strong set of results for the second quarter ended June 30, 2026. The company’s performance came in above expectations, with robust sales growth, solid margin expansion, and strong earnings, underscoring the effectiveness of its innovation-led and productivity-driven strategy.
Key Highlights from Q2 2026
- Reported EPS: \$2.67 per share
- Adjusted EPS (non-GAAP): \$2.89 per share, up 19.4% year-over-year
- Net Sales: \$2.46 billion, up 10.9% year-over-year
- Sales Change Excluding Currency (non-GAAP): up 8.9%
- Organic Sales Growth (non-GAAP): up 7.6%
- Full Year 2026 Guidance:
- Reported EPS: \$9.40 to \$9.70
- Adjusted EPS (non-GAAP): \$10.00 to \$10.30
Segment Performance
Materials Group
- Sales: \$1.80 billion, up 15.9% (11.5% ex. currency, 9.7% organic)
- Volume/mix growth: high single digits; price up low single digits
- High-value categories: up mid-single digits
- Base categories: up low double digits
- Reported operating margin: 15.6%
- Adjusted operating margin (non-GAAP): 15.8%, up 20 basis points
- Adjusted EBITDA margin: 18.0%, up 20 basis points
Solutions Group
- Sales: \$667 million, down 0.5% (up 2.6% ex. currency and organic)
- High-value and base categories: both up low single digits
- Apparel categories: up high single digits
- Reported operating margin: 8.9%
- Adjusted operating margin: 11.5%, up 150 basis points
- Adjusted EBITDA margin: 18.6%, up 150 basis points
Capital Deployment and Balance Sheet
- Capital Returned to Shareholders: \$347 million in H1 2026 (share repurchases + dividends)
- Shares Repurchased: 1.2 million for \$198 million
- Net Debt to Adjusted EBITDA: 2.3x (end Q2 2026)
- Share Count: Down 2.1 million YoY (net of dilution)
Tax Rates and Cost Reduction
- Reported effective tax rate (Q2 2026): 27.8%
- Adjusted tax rate (Q2 2026): 27.4%
- Pre-tax savings from restructuring (H1 2026): ~\$34 million
- Pre-tax restructuring charges (H1 2026): ~\$34 million
Cash Flow and Liquidity
- Adjusted Free Cash Flow (Q2 2026): \$365.4 million (up from \$188.9 million in Q2 2025)
- YTD Adjusted Free Cash Flow: \$469.8 million (up from \$135.8 million YTD 2025)
- Cash and Equivalents: \$227 million (end Q2 2026)
Financial Position (Q2 2026 vs Q2 2025)
- Total Assets: \$9.21 billion (up from \$8.57 billion)
- Total Shareholders’ Equity: \$2.32 billion (up from \$2.20 billion)
- Total Debt: \$3.68 billion
Guidance and Outlook
The company reaffirmed and slightly raised full-year guidance, expecting reported EPS of \$9.40 to \$9.70 and adjusted EPS of \$10.00 to \$10.30 for FY 2026. Importantly, this guidance excludes an estimated \$0.60 per share impact from restructuring and other items, suggesting the underlying core business momentum remains strong.
Strategic and Operational Commentary
CEO Deon Stander emphasized the company’s focus on innovation and service-led differentiation, driving organic growth across both high-value and base categories. The company continues to leverage its productivity playbook to expand margins and maintain earnings growth, while also demonstrating a commitment to returning capital to shareholders.
Avery Dennison’s balance sheet remains robust, providing flexibility for further investment, M&A, and shareholder returns. The management highlighted operational agility and execution excellence as key drivers of the positive results.
Risks and Forward-Looking Statements
Shareholders and potential investors should note: The company outlined several risks that could affect future performance, including:
- Global economic and geopolitical uncertainty (including conflicts and trade relations)
- Raw material costs and availability
- Foreign currency volatility
- Competition in pricing and market expansion
- Integration of acquisitions
- Technology and cybersecurity risks
- Tax laws and regulatory changes
- Labor market challenges and retention
- Potential legal and regulatory proceedings
The company specifically calls out ongoing geopolitical tensions (US-China, Russia-Ukraine, Israel-Hamas, and Middle East hostilities) and macroeconomic headwinds as potential risks.
Summary Table of Key Financials (Q2 2026 vs Q2 2025)
| Q2 2026 | Q2 2025 | Change | |
|---|---|---|---|
| Net Sales | \$2,462.9M | \$2,220.5M | +10.9% |
| Adjusted Operating Income | \$334.6M | \$286.7M | +16.7% |
| Adjusted EBITDA | \$367.5M | \$286.7M | +17.1% |
| Net Income | \$204.1M | \$189.0M | +8.0% |
| Adjusted Net Income | \$220.5M | \$189.5M | +16.4% |
| Adjusted EPS | \$2.89 | \$2.42 | +19.4% |
| Adjusted Free Cash Flow | \$365.4M | \$188.9M | +93.5% |
Conclusion: Price-Sensitive Highlights for Investors
- EPS and Adjusted EPS beat expectations, with robust double-digit growth in top- and bottom-line metrics.
- Raised full-year guidance signals confidence in ongoing performance and could be price supportive.
- Strong capital returns and disciplined balance sheet management enhance shareholder value.
- Material cost controls, productivity, and innovation are driving margin expansion—a key focus for investors.
- Potential risks—macro, geopolitical, raw material, FX, and regulatory—remain, warranting continued monitoring.
Overall, this is a very positive report, with multiple potential share price catalysts including earnings outperformance, increased guidance, and strong cash flow generation.
Disclaimer: This summary is for informational purposes only and does not constitute investment advice. Investors should review the full company filings and consult their financial advisor before making investment decisions. Past performance is not indicative of future results. Forward-looking statements are inherently subject to risks and uncertainties.