Hershey Company Reports Robust Q2 2026 Results: Strong Earnings Recovery and Upward Guidance Revision
Key Highlights from the Q2 2026 Financial Report
- Net Sales: Q2 consolidated net sales rose 6.6% year-over-year to \$2.79 billion.
- Net Income: Reported net income surged to \$457.7 million (\$2.26 per diluted share), up a staggering 629% compared to Q2 2025.
- Adjusted Earnings: Adjusted EPS grew 57% to \$1.90 per diluted share.
- Gross Margin Expansion: Reported gross margin soared to 45.3% from 30.5% in Q2 2025, with adjusted gross margin up 350 basis points to 41.6%.
- Operating Profit: Reported operating profit jumped 233% to \$642.6 million; adjusted operating profit up 37% to \$563.5 million.
- Guidance Raised: The company narrowed and raised the lower end of its full-year 2026 guidance for net sales, organic growth, reported and adjusted EPS. Now expects:
- Net sales growth: 4.5% to 5%
- Organic sales growth: 3% to 3.5%
- Reported EPS growth: 82% to 89%
- Adjusted EPS growth: 32.5% to 35%
- Adjusted EPS range: \$8.36 to \$8.52 (vs. \$6.31 in 2025)
- Tax Rate: Adjusted effective tax rate for Q2 was 24.2%, down 860 basis points year-over-year.
- Acquisition Impact: The 2025 acquisition of LesserEvil contributed 2.7 percentage points to net sales growth in Q2 and ~21.4 points to Salty Snacks segment growth YTD.
- Cost Savings: The “Advancing Agility & Automation Initiative” is expected to generate ~\$100 million in savings for 2026.
Business Segment Performance
North America Confectionery
- Q2 net sales reached \$2.17 billion, up 4.2% year-over-year.
- Organic, constant currency sales up 4.2%, driven by price realization (+14 points) but volume declined 10 points due to price elasticity and shipment variability.
- Segment income was \$705.8 million (+40.1%), with margin rising to 32.5% (+830 bps).
- Hershey’s U.S. candy, mint, and gum retail takeaway up 3.7% for 12 weeks ending July 19, but market share declined due to increased competition and innovation from rivals.
North America Salty Snacks
- Segment net sales reached \$387.8 million, up 22.9% year-over-year, largely due to the LesserEvil acquisition.
- Organic growth was modest at 0.6%; volume up 4 points, but price realization was a 3-point headwind from higher trade investment.
- Segment income dropped 5.9% to \$62.6 million; margin fell to 16.1% (-500 bps) due to higher logistics costs, increased marketing investment, and unfavorable mix.
- Retail salty snack sales (excluding LesserEvil) up 6.5% in the U.S. for the period, continuing to gain market share.
International Segment
- Q2 net sales grew 5.7% to \$225.9 million. Organic, constant currency growth was 2.1%, with price realization of ~10 points offset by an 8% volume decline.
- Segment loss was \$5.1 million (down \$24.9 million YoY) due to higher input costs and increased advertising, partially offset by price and productivity initiatives. Margin dropped to -2.3% (-1,160 bps).
Other Key Financials and Guidance
- Effective Tax Rate: Reported at 22.2% (down from 57.9% Q2 2025) due to prior-year tax reserve increases and commodity hedge impacts.
- Capital Expenditures: Expected to be \$425-\$475 million for 2026.
- Interest Expense: Forecast at \$200-\$210 million for 2026.
- Unallocated Corporate Expense: Up 11.2% to \$199.7 million in Q2, driven by investments in technology and capabilities.
- Balance Sheet: Total assets stood at \$13.97 billion as of June 28, 2026, with cash and equivalents at \$792 million (down from \$926 million at year-end 2025).
Non-GAAP Adjustments and Comparability Items
- Derivative Mark-to-Market Gains: \$102.9 million gain in Q2 2026 (vs. \$200.7 million loss in Q2 2025), significantly impacting reported results.
- Business Realignment and Integration Costs: Totaled \$23.8 million in Q2 2026, related to restructuring, the Agility & Automation Initiative, and integration of LesserEvil and Sour Strips acquisitions.
- Tax Effects: Adjustments for all items are reflected in non-GAAP measures.
Price-Sensitive and Shareholder-Relevant Information
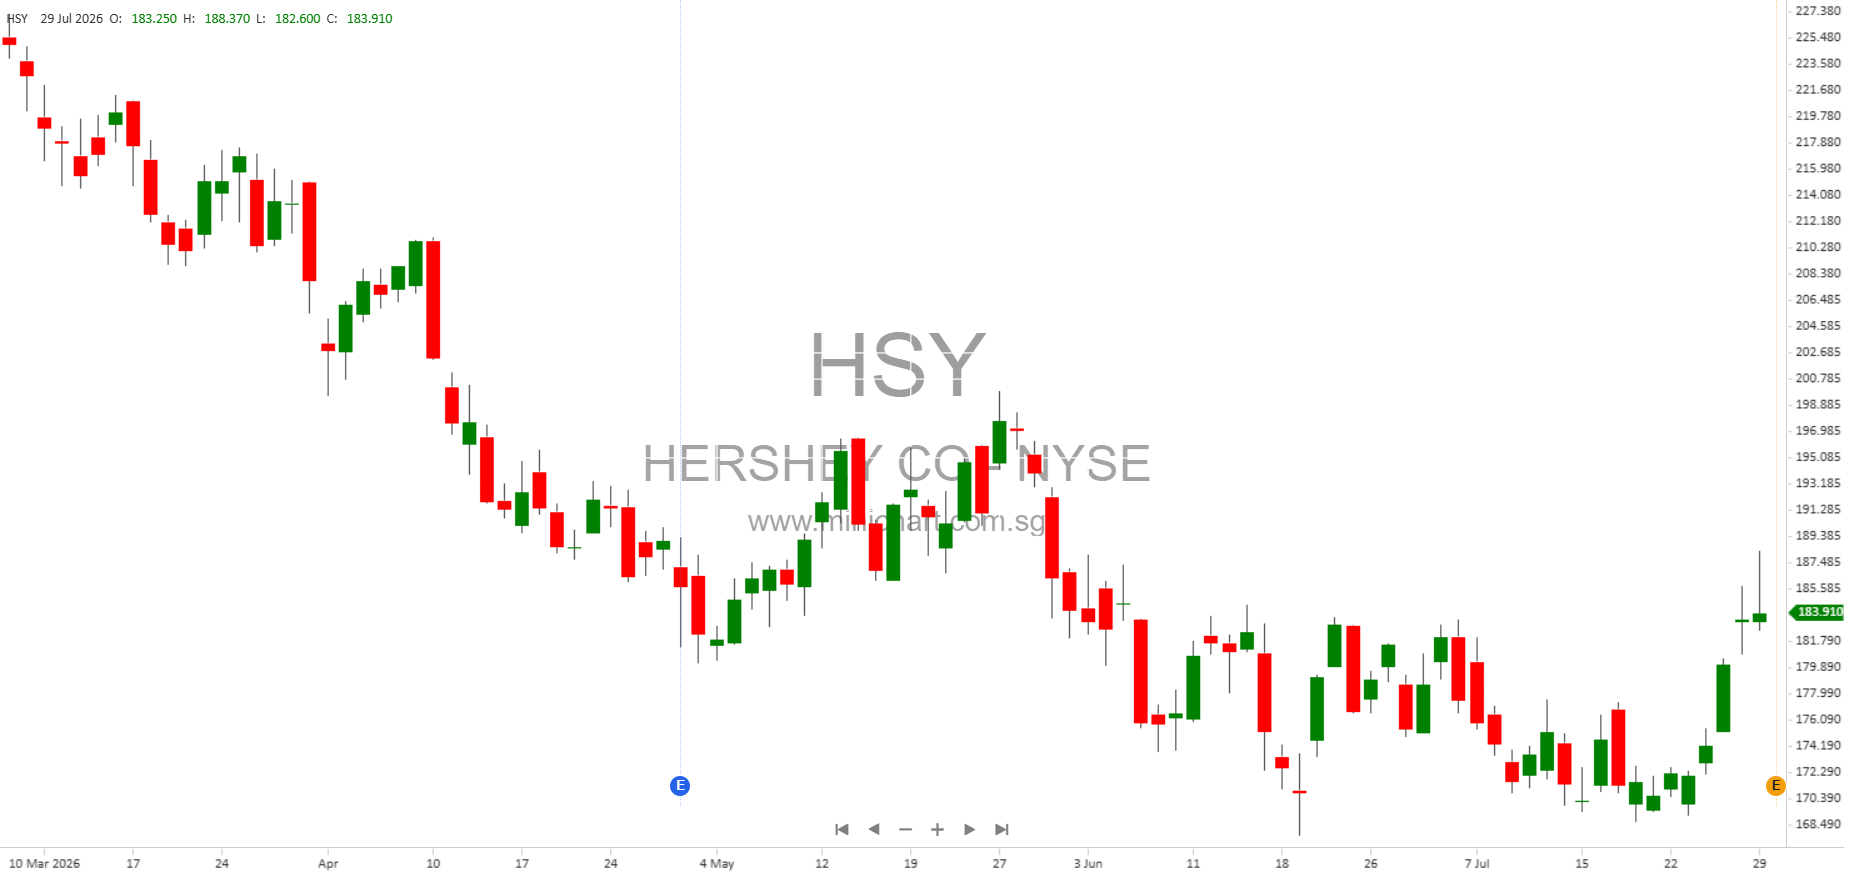
- Significant Earnings Recovery: Both reported and adjusted earnings saw substantial increases, driven by gross margin expansion, pricing power, and operational efficiency.
- Guidance Raised: The upward revision of full-year guidance for both sales and earnings is a strong positive for share valuation.
- Acquisition Synergies: The impact from the LesserEvil acquisition was meaningful, particularly in the Salty Snacks segment, contributing to top-line growth.
- Margin Expansion: Improvements in gross and operating margins, as well as tax rate reductions, are likely to be viewed favorably by investors seeking profitability improvements.
- Segment Performance Divergence: While Confectionery margins soared, Salty Snacks segment income fell, and International swung to a loss, highlighting execution and cost challenges that investors should watch.
Risk Factors and Forward-Looking Statements
Hershey’s outlook is subject to a range of risks, including supply chain disruptions, commodity price volatility, regulatory changes, competitive pressures, international expansion challenges, and the successful execution of acquisitions and strategic initiatives.
Conclusion
Hershey’s Q2 2026 financial report delivers strong evidence of earnings recovery, margin expansion, and growth momentum, reinforced by upwardly revised full-year guidance. The report contains several price-sensitive elements—especially the significant earnings beat, strong margin recovery, and improved outlook—that are likely to positively influence the company’s share price. Shareholders should also note the ongoing integration costs, volatility in international results, and rising corporate expenses as areas to monitor.
Disclaimer: This article is for informational purposes only and does not constitute investment advice. Investors should conduct their own research or consult a financial advisor before making investment decisions. Forward-looking statements in this article are subject to risks and uncertainties that could cause actual results to differ materially.