Life Time Group Holdings, Inc. (NYSE: LTH) Delivers Strong Q2 2026 Results, Raises Full-Year Outlook
Key Financial Highlights
- Revenue growth: Q2 2026 revenue reached \$866.0 million, a 13.7% increase year-over-year. For the first six months, revenue was \$1.65 billion, up 12.8% from the prior year.
- Net income: Net income for Q2 was \$101.4 million, up 40.6% from Q2 2025. Six-month net income was \$189.5 million, a 27.9% increase.
- Diluted EPS: Q2 diluted earnings per share (EPS) was \$0.45, up 40.6%. Adjusted EPS was \$0.48, up 29.7%.
- Adjusted net income and EBITDA: Adjusted net income for Q2 was \$109.8 million (+30.6% y/y). Adjusted EBITDA was \$246.5 million (+16.8%). For H1, adjusted net income was \$206.1 million (+29.0%) and adjusted EBITDA \$473.2 million (+17.5%).
- Comparable center revenue: Rose 9.1% in Q2, and 8.9% for the first half.
- Membership growth: Center memberships grew to 860,041 (+1.2% y/y, +2.6% since March 31, 2026). Total subscriptions, including on-hold memberships, reached 910,520 (+1.3% y/y).
- Average center revenue per membership: Q2 was \$993, up 11.8% y/y. For H1, \$1,923 (+11.0%).
Operational and Strategic Developments
- Club Expansion: Five new centers opened in Q2, bringing the total to 195 as of June 30, 2026. The company is on track to open 14 new clubs in 2026, with most being large-format, ground-up constructions.
- Capital Expenditures:
- Q2 growth capex: \$190.1 million (+13.8% y/y)
- Q2 maintenance capex: \$40.7 million (+13.4%)
- Q2 modernization/tech capex: \$32.5 million (+70.2%)
- Total Q2 capex: \$263.3 million (+18.6%)
- H1 2026 capex: \$523.2 million (+43.5%)
- Liquidity and Debt:
- Net debt leverage ratio improved to 1.4x (from 1.8x a year ago).
- Total available liquidity: \$855.7 million (\$632.1 million available on \$650 million revolver + \$223.6 million cash).
- No outstanding borrowing on revolver at quarter end.
- Share Repurchase: During Q2, about 2.2 million shares repurchased for ~\$62.7 million at an average \$28.59 per share under a \$500 million share buyback authorization.
- Credit Upgrades: Fitch and S&P both upgraded the issuer credit rating from ‘BB-‘ to ‘BB’ in April and June 2026, respectively.
2026 Full-Year Guidance (Raised and Updated)
- Revenue: \$3,350–\$3,375 million (was \$3,320–\$3,350 million previously; up 12.3% y/y at midpoint)
- Net Income: \$358–\$363 million (down from \$373.7 million in 2025, but significantly higher than prior guidance of \$340–\$345 million)
- Adjusted Net Income: \$394–\$402 million (+22.3% y/y)
- Adjusted EBITDA: \$940–\$955 million (+14.8% y/y)
- Comparable Center Revenue Growth: Now expected at 7.9–8.3% (up from 6.9–7.5%)
- New club openings: 14 expected (tightened from previous 12–14), with total square footage of 1.3 million sq. ft.—almost double the 2024/2025 class average.
- Capital Expenditures:
- Maintenance: \$140–\$150 million
- Modernization/Tech: \$140–\$150 million (increased from \$130–\$140 million to accelerate group training programs)
- Growth: \$885–\$910 million
- Sale-leaseback transactions: Targeting ~\$400 million for the year, with \$200 million more to close in H2.
- Interest Expense: \$59–\$63 million net, with \$28–\$30 million capitalized for construction in progress.
- Net Debt / Adjusted EBITDA: Goal to manage at or below 2.0x.
- Cash Income Tax Expense: \$103–\$105 million (increased from previous \$80–\$83 million, due to taxable gains on sale-leaseback and higher earnings).
- Provision for income tax rate: 27% (down from previous 28%).
- Year-end diluted shares: 227–229 million (excluding incremental repurchases; down from 228–230 million).
Operational Insights
- Membership trends: Growth is driven by higher engagement, increased utilization of offerings such as Dynamic Personal Training, and a healthier membership mix. Notably, there has been a significant reduction in qualified memberships administered through medical insurance providers, which carry much lower average dues.
- Expense Management: Center operating expenses rose 12.3% y/y to support new/ramping centers, increased club utilization, and in-center revenue growth. G&A and marketing expenses increased 7.0% y/y, mainly due to higher incentive and benefit costs.
- Legal/One-offs: Net income benefited from \$3.7 million in tax-effected net cash proceeds from partial legal claim settlements and \$1.5 million in tax-effected gains on sale-leaseback transactions. Prior year included CARES Act retention credits, now lapping.
Key Metrics and Non-GAAP Measures
- Free Cash Flow (Q2): \$146.5 million (up from \$112.5 million in Q2 2025). H1: \$85.3 million.
- Trailing-Twelve-Month Adjusted EBITDA: \$895.8 million (up from \$759.8 million a year ago).
- Net Debt Leverage Ratio: 1.4x (down from 1.8x), indicating a stronger balance sheet.
Other Notable Developments
- Life Time continues to be recognized as a “Great Place to Work”, with more than 52,000 team members.
- The company highlighted the launch of its AI-powered health companion in its app, as well as expanded group training programs and a broad range of healthy living products and events.
Potential Share Price Drivers and Shareholder Considerations
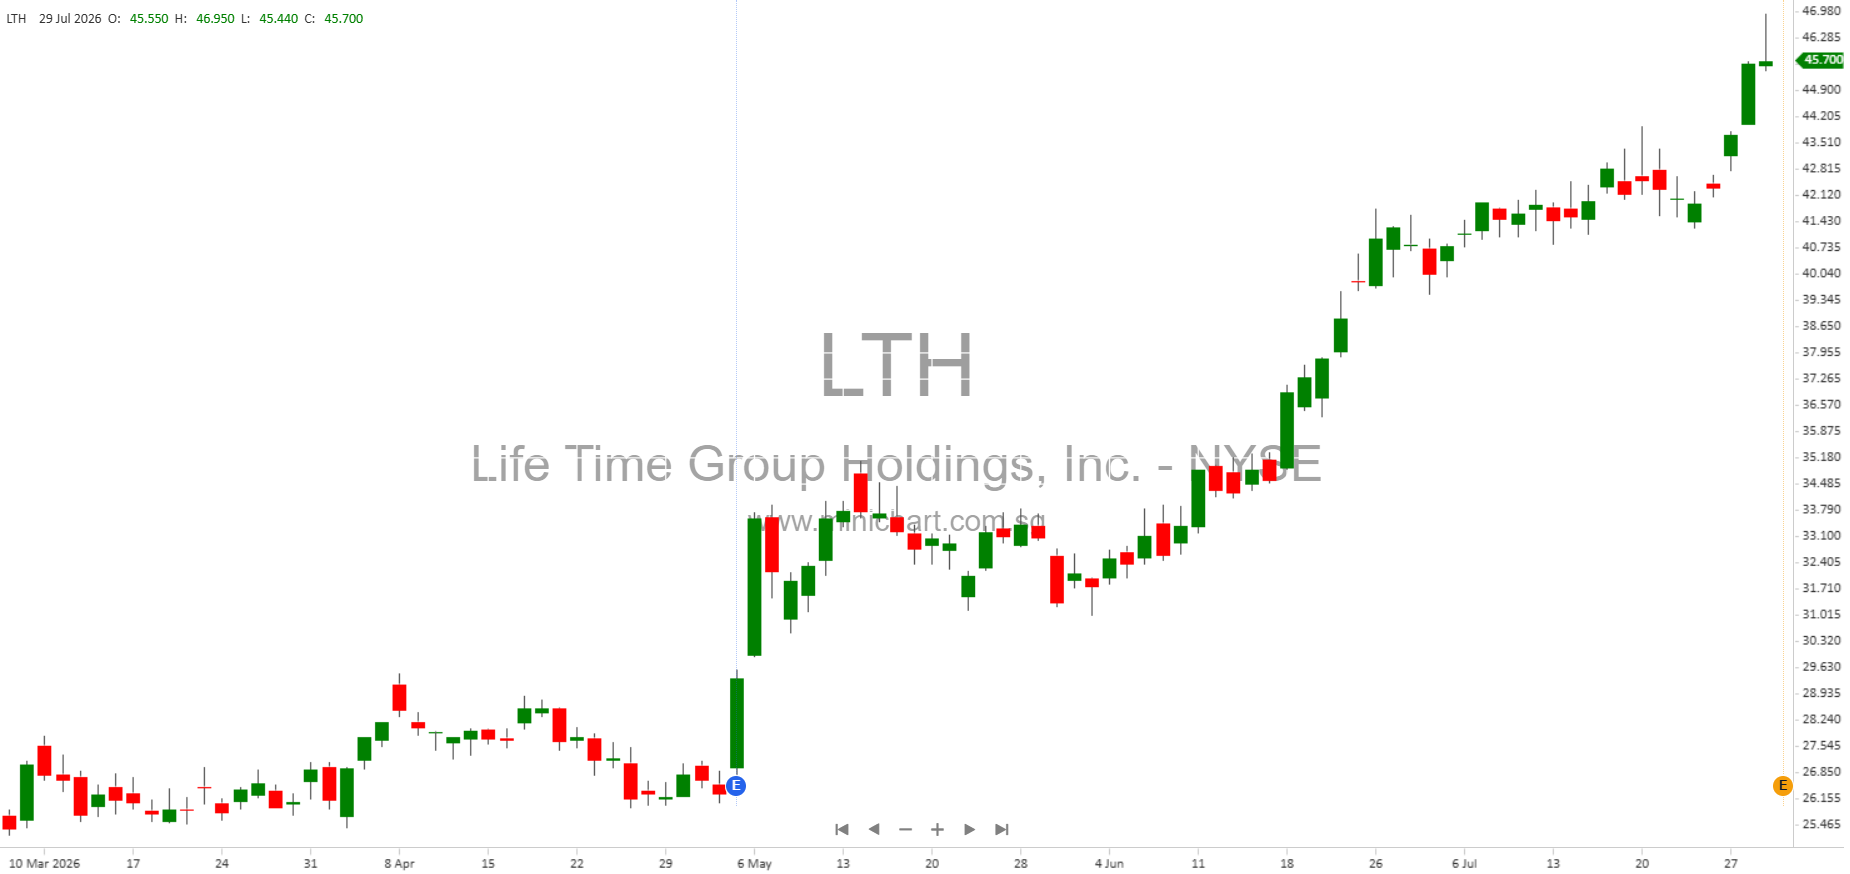
- Raised revenue and profitability guidance for FY 2026 is likely to be positively received by investors, indicating management’s confidence in sustained growth and margin expansion.
- Credit rating upgrades by both Fitch and S&P could reduce borrowing costs and signal improved financial health to the market.
- Significant share repurchase activity (2.2 million shares in Q2 and ongoing \$500 million buyback program) may support the share price and indicate management’s belief in undervaluation or future growth.
- Accelerated club expansion and higher capital expenditure guidance reflect robust demand and potential future revenue streams but may increase execution risk.
- Improved net debt leverage ratio and enhanced liquidity position reduce financial risk.
- Taxable gains from sale-leaseback activity and higher income tax expense guidance are noteworthy for earnings modeling.
- Reduction in lower-dues insurance-based memberships in favor of higher-value members could continue to boost average revenue per member, supporting margin growth.
- Modernization and technology investments may provide future operating leverage and competitive advantages.
Conclusion
Life Time Group Holdings has delivered a robust second quarter, raised its outlook, and is showing strong momentum across key operational and financial metrics. Upgrades from credit agencies, active share repurchases, and a disciplined approach to club expansion and capital allocation are all likely to be viewed favorably by the market. Investors should watch for execution on new club openings, continued improvement in membership mix, and delivery on raised guidance as key factors for share price performance in the coming quarters.
Disclaimer: This article is for informational purposes only and does not constitute investment advice. Investors should consult their own advisors and review the company’s official filings and disclosures before making any investment decisions.