A. O. Smith Reports Q2 2026 Results: Growth in North America, Challenges in China, Shareholder Returns
Key Highlights
- Q2 2026 Net Sales: \$1.0 billion (down 1% YoY)
- Net Earnings: \$124.9 million (down 18% YoY)
- Adjusted Earnings: \$142 million (down 7% YoY)
- Diluted EPS: \$0.91 (down 15% YoY); Adjusted EPS: \$1.03 (down 4% YoY)
- Strong Free Cash Flow: \$233.3 million in H1 2026 (up 67% YoY)
- Share Repurchase Target for 2026 Increased by 50% to \$300 Million
- Full-Year 2026 Guidance:
- Sales growth of 2%–3% (narrowed from 2%–4%)
- Diluted EPS: \$3.60–\$3.75
- Adjusted EPS: \$3.70–\$3.85 (narrowed from \$3.70–\$4.00)
Segment Performance
North America
- Sales: \$820.5 million (up 5% YoY), driven by:
- Leonard Valve acquisition (\$16 million boost)
- 21% growth in boiler sales
- Carryover pricing actions
- Partially offset by lower residential water heater volumes
- Organic Sales (excluding Leonard Valve): Up 3% YoY
- Segment Earnings: \$177.2 million (down from \$198.1 million YoY)
- Segment Margin: 21.6% (down from 25.4% YoY)
- Adjusted Segment Earnings: \$199.8 million; Adjusted Margin: 24.4%
- Restructuring & Impairment: \$22.6 million in expenses due to targeted actions in water treatment; expected annual savings of \$6–8 million starting 2027
Rest of World
- Sales: \$194.9 million (down 19% YoY), driven mainly by China
- China Sales: Down 28% in local currency, reflecting continued weakness in consumer demand and challenging market conditions
- Segment Earnings: \$10.2 million (down from \$25.3 million YoY)
- Segment Margin: 5.2% (down from 10.5% YoY)
- Currency Impact: \$6 million favorable translation, mostly in China
- Management Response: Continued cost management to offset lower volumes; ongoing strategic assessment of China business
Balance Sheet and Capital Allocation
- Cash & Cash Equivalents: \$181.3 million as of June 30, 2026
- Debt: \$637.5 million, leverage ratio at 25.7%, up due to Leonard Valve acquisition
- Operating Cash Flow: \$253.8 million (up 42% YoY)
- Free Cash Flow: \$233.3 million (up 67% YoY)
- Share Repurchases: \$162.4 million spent to repurchase 2.6 million shares in H1 2026; authority remains for ~3.2 million more shares
- Dividend: Board declared \$0.36 per share quarterly dividend, payable August 17, 2026 (record date July 31, 2026)
2026 Outlook and Guidance (Updated)
- Net Sales: \$3.9–\$3.95 billion vs. \$3.83 billion in FY2025
- Diluted EPS: \$3.60–\$3.75 (vs. \$3.85 in FY2025)
- Adjusted EPS: \$3.70–\$3.85 (vs. \$3.85 in FY2025)
- Restructuring & Impairment Expenses: Approx. \$20 million for FY2026, of which \$22.6 million recognized in Q2; proceeds from asset sales expected late 2026
- Share Repurchases: Target raised to \$300 million (up from \$200 million)
Management Commentary
“Our team continued to execute well in the second quarter, demonstrating the resilience of the A. O. Smith team and our business model. While North America continued to face softer residential water heater demand, we are pleased with the progress we are making in our market share, as well as the strong growth in our boiler business. Operational excellence and delivering for our customers remained key priorities throughout the quarter. In China, we managed through a significantly weaker market environment and continue our strategic assessment of the business. We remain committed to disciplined execution and investing in opportunities that will strengthen our competitive position and drive long-term value creation.”
– Steve Shafer, Chairman and CEO
Potential Share Price Drivers and Risks
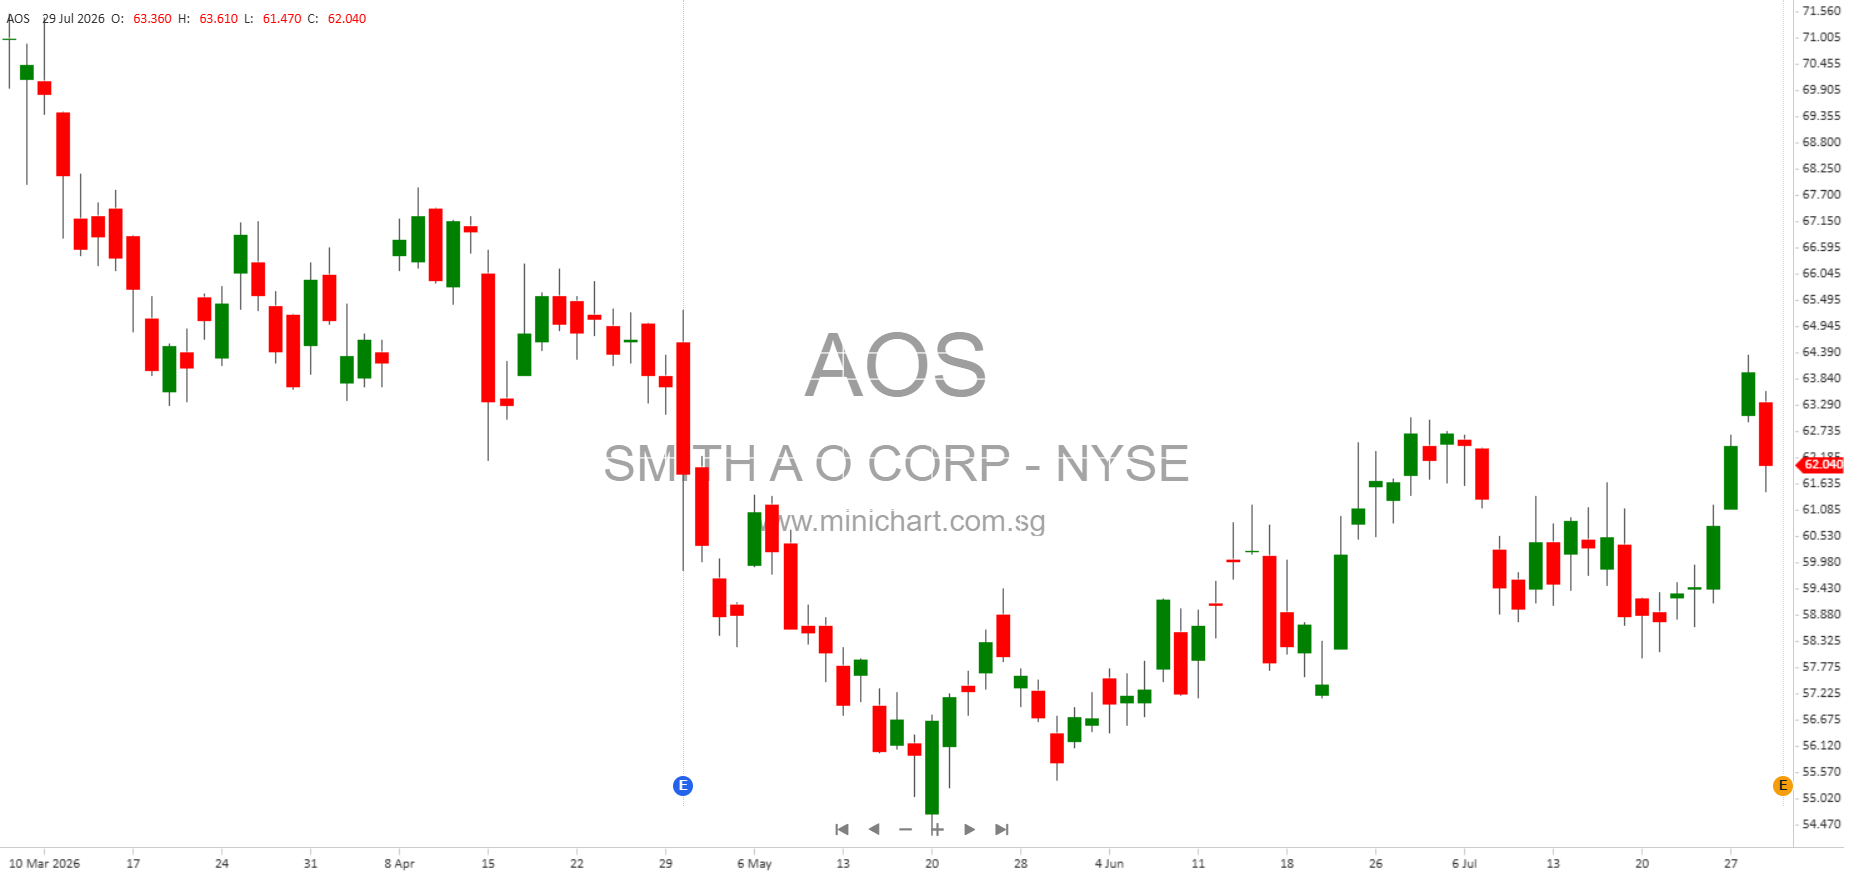
- Positive: Raised share repurchase target, strong free cash flow, ongoing cost controls, and anticipated restructuring savings support shareholder value and could support share price.
- Negative: Weakness in China and soft U.S. residential water heater demand remain key risks; restructuring and impairment charges impact current earnings, but are expected to yield future savings.
- Other Risks: Guidance excludes potential impacts from future acquisitions, further assessment of China operations, and new U.S. tariff policies. Management flagged risks around global inflation, supply chain, tariffs, and geopolitical tensions (Ukraine, Middle East), as well as regulatory changes and competitive pressures.
Financial Tables (Summarized)
- Q2 2026 vs. Q2 2025 Net Sales: \$1,004.3M vs. \$1,011.3M
- Q2 2026 vs. Q2 2025 Net Earnings: \$124.9M vs. \$152.2M
- Q2 2026 vs. Q2 2025 Adjusted EPS: \$1.03 vs. \$1.07
- H1 2026 vs. H1 2025 Free Cash Flow: \$233.3M vs. \$139.9M
- Balance Sheet: Assets \$3,644.5M, Stockholders’ Equity \$1,841.9M, Debt \$637.5M (as of 6/30/26)
Conclusion
A. O. Smith delivered a resilient Q2 2026 performance in a challenging macro environment. North America saw growth driven by the Leonard Valve acquisition and strong boiler sales, even as residential water heater demand softened. The China market remains a concern with significant sales declines. In response, the company has executed cost controls, restructured its water treatment operations, and increased its shareholder returns via a substantial boost to its share repurchase target. The narrowed guidance reflects realistic expectations amid ongoing headwinds. Shareholders should monitor management’s actions in China, the realization of restructuring savings, and any impacts from global economic and policy changes.
Disclaimer: This article is for informational purposes only and does not constitute investment advice. Investors should conduct their own research and consider their own circumstances before making investment decisions. Forward-looking statements are subject to risks and uncertainties; actual results may differ materially from those discussed.