Wingstop Inc. Q2 2026 Financial Results: Key Highlights and Investor Takeaways
1. Executive Summary
Wingstop Inc. has released its quarterly report for the period ended June 27, 2026. The results show notable movements across revenue, profitability, share issuance and buybacks, and capital returns to shareholders. Investors should pay close attention to the ongoing stock repurchases, dividend payments, and the company’s persistent stockholders’ deficit, all of which may have significant implications on share value.
2. Key Financial Highlights
- Revenue Growth: For the thirteen weeks ended June 27, 2026, Wingstop reported revenues of \$79.9 million, reflecting ongoing growth in its top line.
-
Net Income and EPS:
- Net income reached \$61.2 million for the latest reported period, and \$119.0 million for the year-to-date period.
- Basic earnings per share (EPS) were \$2.24 for the year-to-date period, and diluted EPS was \$2.23, up significantly year-over-year, indicating strong profitability.
- Comprehensive Income: Comprehensive income for the latest quarter was \$30.2 million, and \$31.5 million for the year-to-date period, reflecting the impact of foreign currency translation adjustments and other items.
- Stockholders’ Deficit: The company continues to report a substantial stockholders’ deficit. As of June 27, 2026, the deficit stands at (\$772.99 million), up from (\$744.92 million) at the end of the previous fiscal year. This persistent negative equity is a material point for investors.
- Shares Outstanding: The number of common shares outstanding as of July 28, 2026, was 27,242,546, reflecting both new shares issued (primarily under stock plans) and shares repurchased and retired during the period.
3. Capital Allocation: Dividends and Share Repurchases
- Dividends: Wingstop continues to return cash to shareholders through regular dividend payments. For the twenty-six weeks ended June 27, 2026, cash dividends paid totaled approximately \$8.2 million, with additional dividends declared but not yet paid. This consistency can be viewed favorably by income-focused investors.
-
Share Repurchases:
- The company was highly active in repurchasing its own shares, retiring approximately \$72.5 million worth of stock in Q2 2026 and \$78.5 million for the year-to-date period. This aggressive buyback activity reduces share count and may support EPS growth and share price appreciation, but it also contributes to the growing stockholders’ deficit.
4. Balance Sheet & Liquidity
- Total Assets: As of June 27, 2026, total assets stood at \$693.4 million.
- Long-Term Investments: The company holds \$90.7 million in long-term investments, up slightly from the prior period.
- Stockholder Deficit: The persistent and growing negative equity is primarily driven by cumulative share repurchases and dividends exceeding retained earnings and contributed capital. This is a red flag for balance sheet strength and could become a concern if the company faces liquidity issues or needs to raise capital.
5. Share Structure
- Authorized Shares: 100,000,000 shares of common stock are authorized.
- Shares Issued and Outstanding: The company issued 101,952 new shares under stock plans in H1 2026, with 27,240,351 shares outstanding at period end.
6. Investor Considerations & Potential Price-Sensitive Issues
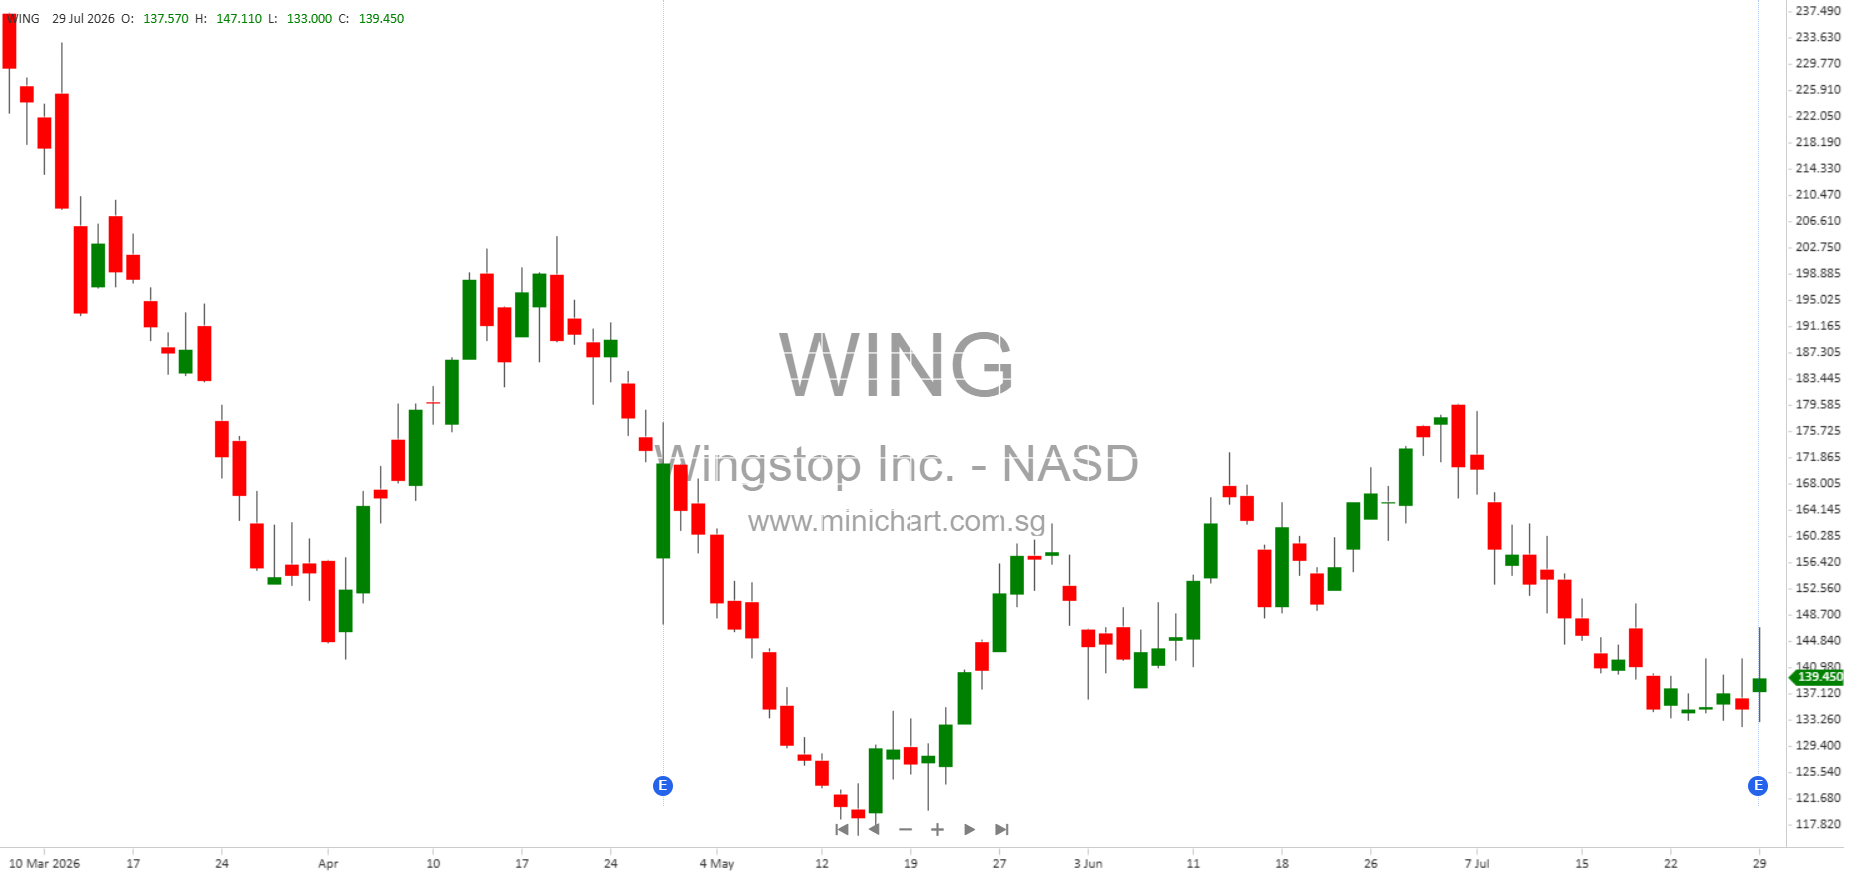
- Ongoing Stock Repurchases: The large and ongoing share buybacks are reducing float, supporting EPS growth, and may be seen as a sign of management confidence. However, they are also driving the company deeper into a stockholders’ deficit. If not carefully managed, this could raise questions about capital structure and long-term financial health, impacting investor sentiment and share price.
- Stockholders’ Deficit: The negative equity position is significant. While not uncommon for companies with aggressive buyback programs, it may limit future financing flexibility and increase risk if operating performance falters or the credit environment tightens.
- Dividend Policy: The company’s commitment to dividends is a positive for shareholders, but it also puts pressure on cash flows, especially in conjunction with substantial buybacks.
- Earnings Outperformance: The material increase in net income and EPS is positive and could drive share price upward if the market views these trends as sustainable.
7. Summary Table
| Metric | Q2 2026 / YTD |
|---|---|
| Revenue | \$79.9 million (Q2) |
| Net Income | \$61.2 million (Q2); \$119.0 million (YTD) |
| Basic EPS | \$2.24 (YTD) |
| Diluted EPS | \$2.23 (YTD) |
| Total Assets | \$693.4 million |
| Stockholders’ Deficit | (\$772.99 million) |
| Shares Outstanding | 27,242,546 (July 28, 2026) |
| Dividends Paid | \$8.2 million (YTD) |
| Shares Repurchased | \$72.5 million (Q2); \$78.5 million (YTD) |
8. Conclusion
Investor Impact: Wingstop’s strong profit growth, ongoing capital returns through buybacks and dividends, and growing negative equity position are all highly relevant to share price. The company’s ability to sustain these trends will be closely watched by investors. Any shift in capital allocation policy, liquidity constraints, or slowdown in earnings momentum could have a pronounced effect on the stock.
Price-Sensitive Issues: The aggressive capital return policy (buybacks and dividends) alongside a deepening stockholders’ deficit is a double-edged sword. While supportive of the current share price, it may become a headwind if market sentiment turns or if financial flexibility becomes constrained.
Disclaimer: This article is for informational purposes only and does not constitute investment advice. Investors should conduct their own due diligence and consult with a qualified financial advisor before making investment decisions. The author and publisher are not responsible for any losses incurred as a result of decisions made based on this article.