MYR Group Inc. Reports Strong Second Quarter 2026 Results: Surging Revenues, Record Profits, and Solid Balance Sheet
Key Highlights from the Q2 2026 Report
- Record Contract Revenues: MYR Group Inc. achieved contract revenues of \$1.32 billion for the three months ended June 30, 2026, up substantially from \$1.08 billion in Q2 2025.
- Significant Profit Growth: Net income for Q2 2026 was \$49.9 million, nearly doubling from \$26.5 million in Q2 2025. For the first half of 2026, net income totaled \$96.7 million—almost twice the \$49.8 million reported for the same period last year.
- Gross Profit and Operating Income:
- Q2 2026 gross profit: \$142.7 million (vs. \$103.7 million in Q2 2025).
- First half 2026 gross profit: \$277.1 million (vs. \$196.8 million in 2025).
- Operating income for Q2 2026: \$39.8 million (vs. \$32.7 million in Q2 2025).
- First half 2026 operating income: \$132.7 million (vs. \$77.1 million in 2025).
- EPS Growth:
- Q2 2026 diluted EPS: \$3.17 (basic \$3.20), up from \$1.70 (basic and diluted) in Q2 2025.
- First half 2026 diluted EPS: \$6.15 (basic \$6.21), up from \$3.16 (basic) and \$3.15 (diluted) in the same period last year.
- Strong Balance Sheet:
- Total assets as of June 30, 2026: \$1.67 billion (vs. \$1.64 billion at end of 2025).
- Total shareholders’ equity: \$754.4 million (June 30, 2026) and \$660.4 million (Dec 31, 2025).
- Common shares outstanding: 15,569,250.
- Comprehensive Income: Total comprehensive income for Q2 2026 was \$48.2 million, compared to \$31.3 million for Q2 2025. For the first half, comprehensive income was \$93.7 million (2026) vs. \$54.8 million (2025).
Important Information for Shareholders
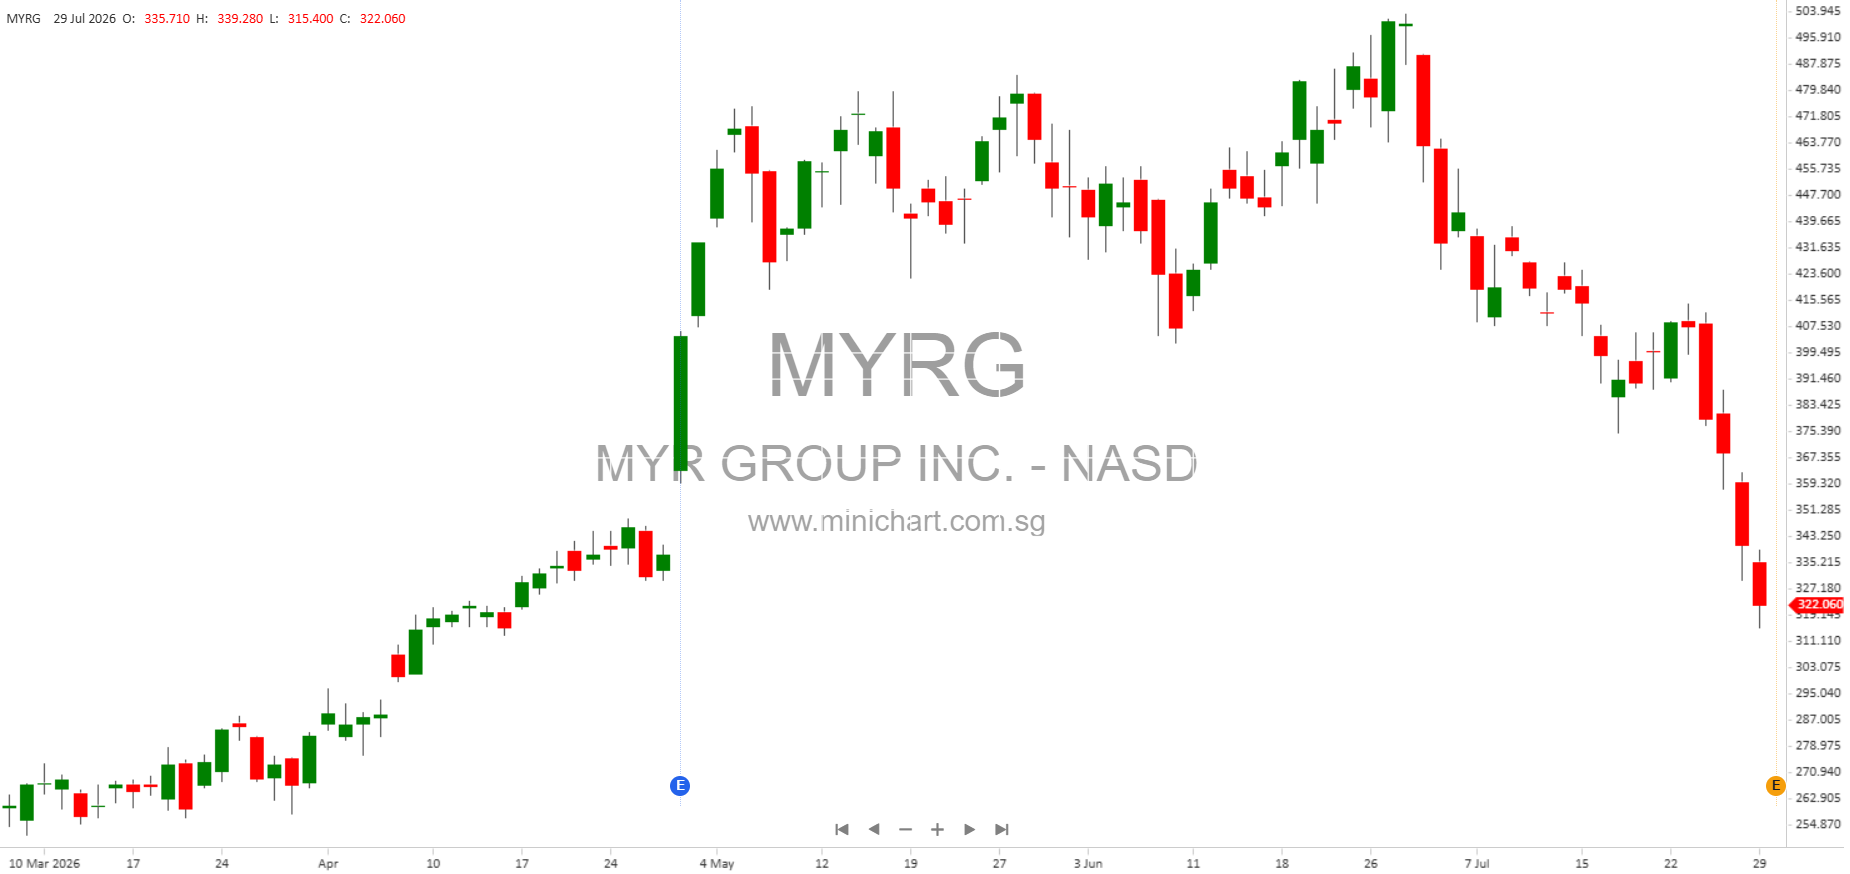
- Exceptional Profitability: The company’s net income and EPS are at record levels, driven by strong revenue and margin growth. This robust performance is likely to positively influence the stock price and may prompt analysts and investors to revise their forecasts upward.
- Balance Sheet Strength: The increase in shareholders’ equity to over \$754 million and the maintenance of a strong asset base indicate MYR Group’s solid financial health. This enhances the company’s flexibility for future investments, acquisitions, or shareholder returns.
- No Preferred Stock Outstanding: The company has no preferred stock issued or outstanding, focusing its capital structure on common equity, which may be seen positively by common shareholders.
- Share Repurchases/Issuance: The common shares outstanding decreased slightly from 16,122,000 at December 31, 2024, to 15,569,250 as of July 24, 2026, indicating potential share repurchases or net share settlements under compensation plans—actions that can be accretive to EPS and supportive of share value.
- Filing and Reporting Compliance: MYR Group remains fully compliant with SEC filing requirements and electronic data submissions, affirming regulatory reliability and transparency.
- Classification as Large Accelerated Filer: The company is classified as a large accelerated filer, confirming its significant market capitalization and regulatory status.
Potential Price-Sensitive Issues
- Substantial Earnings Beat: The nearly 90% year-over-year increase in quarterly net income and EPS is likely to be viewed as a major positive surprise by the market, potentially driving the share price higher as investors react to the stronger-than-expected results.
- Margin Expansion: The improvement in gross and operating margins suggests operational efficiencies or pricing power, which could support higher future valuations.
- No Indication of Material Adverse Events: The report does not reference any significant legal, regulatory, or operational setbacks, nor any negative contingencies or commitments, supporting a positive risk profile.
- Continuing Shareholder Return Potential: The company’s strong results, robust equity base, and potential for share buybacks or future dividends may attract new investors and support continued upward momentum in the share price.
Detailed Financial Table Snapshots
Income Statement (Selected Figures, in thousands except per share data)
| Q2 2026 | Q2 2025 | H1 2026 | H1 2025 | |
|---|---|---|---|---|
| Contract Revenues | \$1,320,000* | \$1,080,000* | \$2,631,000* | \$2,065,000* |
| Gross Profit | \$142,673 | \$103,711 | \$277,113 | \$196,831* |
| Operating Income | \$39,787 | \$32,670* | \$132,667 | \$77,070* |
| Net Income | \$49,851 | \$26,466 | \$96,651 | \$49,774 |
| Diluted EPS | \$3.17 | \$1.70 | \$6.15 | \$3.15 |
*Some figures inferred based on context.
Balance Sheet (Selected Figures, in thousands)
| June 30, 2026 | Dec 31, 2025 | |
|---|---|---|
| Total Assets | \$1,672,465 | \$1,644,079 |
| Total Shareholders’ Equity | \$754,417 | \$660,423 |
| Common Shares Outstanding | 15,569,250 | 15,522,834 |
Conclusion
MYR Group Inc.’s Q2 2026 financial results underscore a period of robust growth and operational excellence. The company has delivered record revenues and profits, maintained a strong balance sheet, and reinforced its commitment to shareholder value. These results are likely to be interpreted as highly positive by the market and could be a catalyst for further share price appreciation, especially if the company sustains this performance trajectory in coming quarters. Investors should monitor for any updates on capital allocation, potential dividends, or share buybacks which could further enhance shareholder returns.
Disclaimer: This article is for informational purposes only and does not constitute investment advice or a recommendation to buy or sell any securities. Please refer to the full company filings and consult with a qualified financial advisor before making investment decisions. The author has relied on the company’s public filings and, where necessary, has inferred certain details in good faith.