Sonos, Inc. Q3 2026 Financial Results: Key Details for Investors
Overview
Sonos, Inc. (Nasdaq: SONO) has released its quarterly report for the period ending June 27, 2026. This report provides a detailed look at the company’s financial performance, changes in equity, and other key items that investors should be aware of.
Key Financial Highlights
- Total Assets: \$823.3 million as of June 27, 2026.
- Total Stockholders’ Equity: \$403.5 million, a notable increase from \$355.2 million at the end of the previous period.
- Net Income (Nine Months Ended June 27, 2026): \$94.8 million.
- Net Income (Three Months Ended June 27, 2026): \$29.9 million.
- Basic Earnings Per Share (Nine Months Ended): \$0.79 per share.
- Diluted Earnings Per Share (Nine Months Ended): \$0.77 per share.
- Basic Earnings Per Share (Three Months Ended): \$0.25 per share.
- Diluted Earnings Per Share (Three Months Ended): \$0.25 per share.
- Gross Profit (Nine Months Ended): \$567.4 million.
- Gross Profit (Three Months Ended): \$149.7 million.
- Research and Development Expenses (Nine Months): \$191.8 million.
- Operating Income (Nine Months): \$110.4 million.
Shareholder Equity Movements
- Significant Buybacks: The company continued to repurchase its own shares, with treasury stock value reaching \$37.4 million, suggesting ongoing capital returns to shareholders.
- Share-Based Compensation: Issuance of common stock under equity incentive plans contributed positively to equity.
- Additional Paid-In Capital: Robust at \$465.97 million.
- Accumulated Other Comprehensive Income: \$1.8 million, indicating some positive currency or marketable securities adjustments.
Operating Performance & Income Statement Notes
- Operating Income: The company remained profitable for both the quarter and nine-month periods, with operating income of \$31.5 million for the latest quarter.
- Interest Income: Sonos generated \$5.4 million in interest income over the nine months, a sign of a strong cash position.
- Comprehensive Income: Total comprehensive income for the nine months was positive, driven by net income and currency adjustments.
- Research and Development: Continued investment in R&D, with expenses at \$191.8 million, underscores Sonos’ commitment to innovation.
Potential Price Sensitive Information and Investor Implications
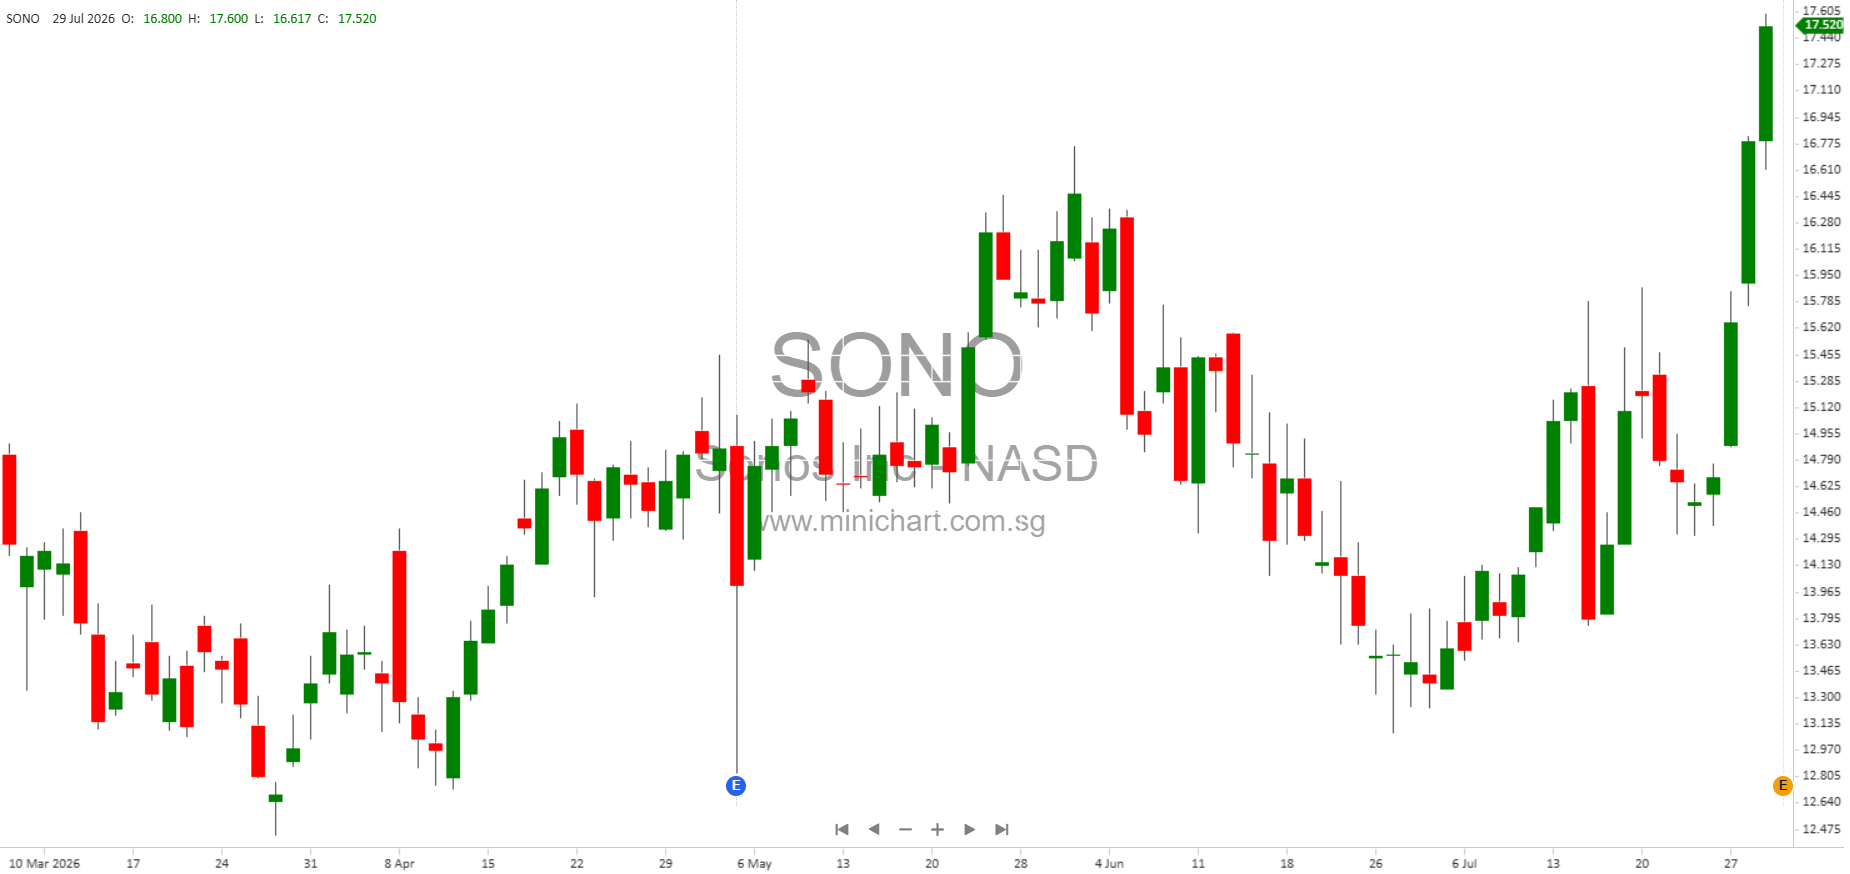
- Improved Profitability: Net income for the nine-month period rose significantly, with EPS metrics that may exceed market expectations. This is a potentially price-moving development for the stock.
- Share Buybacks: The increased treasury stock balance signals an ongoing buyback program, which can provide a floor for the share price and be accretive to EPS.
- Healthy Balance Sheet: With over \$823 million in assets and more than \$400 million in equity, Sonos remains well-capitalized, supporting future investment, buybacks, or potential dividends.
- R&D Investments: Elevated R&D spending could yield new products, reinforcing Sonos’ competitive positioning, but investors should monitor for returns on these investments.
- No Defaults or Senior Securities Issues: The report does not reflect any defaults on senior securities or unregistered sales, removing potential downside risk.
Other Noteworthy Items
- Market Listing: Sonos remains listed on the Nasdaq Stock Market.
- Regulatory Compliance: The company states it is current on its SEC reporting obligations.
- Filing Status: Sonos is not a smaller reporting company or an emerging growth company, indicating a mature business profile.
- No Shell Company Status: Sonos is not considered a shell company.
Conclusion
Sonos, Inc.’s Q3 2026 results reflect strong profitability, significant shareholder returns through buybacks, and continued investment in innovation. The improved earnings and healthy balance sheet are likely to be viewed positively by the market and could potentially drive share price appreciation. Investors should continue to watch Sonos’ product pipeline and capital allocation strategy for further catalysts.
Disclaimer: This article is not investment advice. It is a summary based on Sonos, Inc.’s Q3 2026 SEC filing and is intended for informational purposes only. Investors are encouraged to review the original filings and consult with their financial advisors before making investment decisions. The author is not responsible for investment actions taken based on this article.