Silgan Holdings Inc. Reports Q2 2026 Financial Results: Key Takeaways for Investors
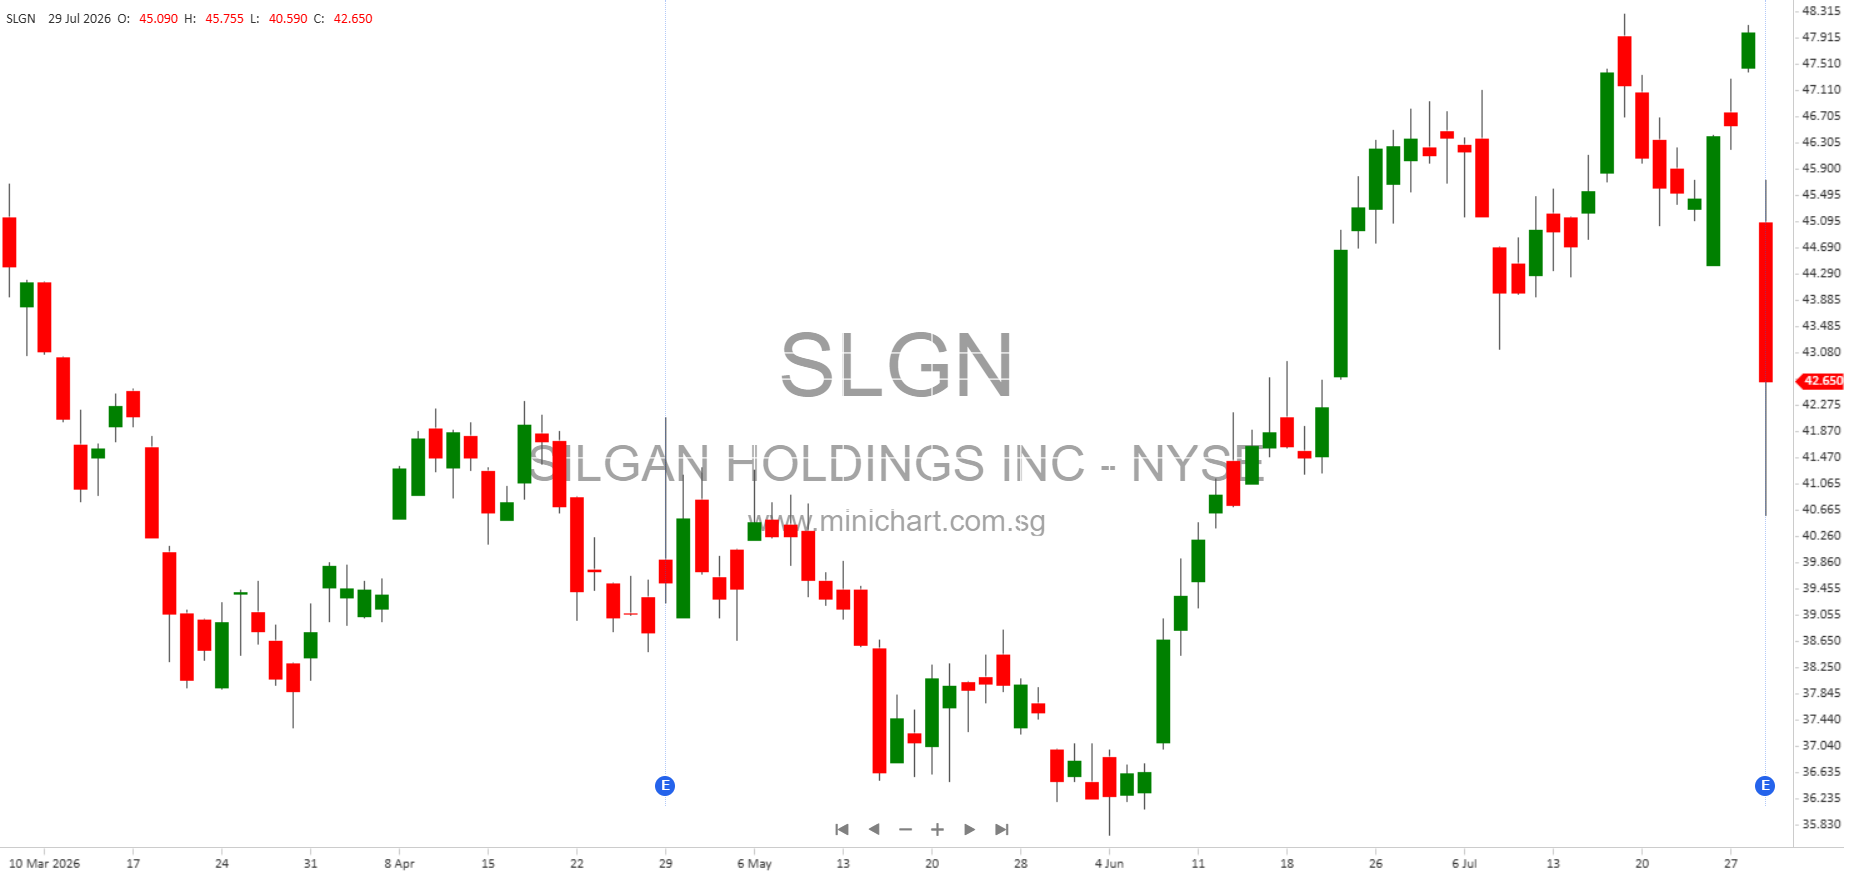
Silgan Holdings Inc. (NYSE: SLGN) has released its financial results for the second quarter and first half of 2026. Here is a detailed breakdown of the report, with a focus on matters that may affect share values and be of interest to shareholders.
1. Results of Operations and Financial Condition
- Silgan issued a press release on July 29, 2026, detailing its financial results for the three and six month periods ended June 30, 2026.
- The company emphasizes that the information furnished is not considered “filed” under Section 18 of the Securities Exchange Act of 1934, nor incorporated by reference in other filings unless specifically mentioned.
2. Condensed Consolidated Statement of Income (Q2 and Six Months Ended June 30)
- Second Quarter Net Income: \$75.8 million
- Six Months Net Income: \$89.0 million
- Basic EPS: \$0.72 (Q2), \$1.31 (Six Months)
- Diluted EPS: \$0.72 (Q2), \$1.31 (Six Months)
- Cash Dividends per Share: \$0.21 (Q2), \$0.42 (Six Months)
- Weighted Average Shares Outstanding (Basic): 105.8 million (Q2), 106.2 million (Six Months)
- Weighted Average Shares Outstanding (Diluted): 107.3 million (Q2), 107.7 million (Six Months)
3. Segment Financial Data
- Dispensing and Specialty Closures: EBIT of \$85.5 million (Q2), \$155.2 million (Six Months)
- Metal Containers: EBIT of \$65.9 million (Q2), \$115.7 million (Six Months)
- Custom Containers: EBIT of \$27.2 million (Q2), \$24.9 million (Six Months)
- Corporate: EBIT loss of (\$15.4) million (Q2), (\$31.1) million (Six Months)
- Adjusted EBIT: Total \$107.6 million (Q2), \$198.9 million (Six Months)
4. Balance Sheet Highlights (As of June 30, 2026 vs. 2025)
- Cash and Cash Equivalents: \$351.5 million (2026), \$955.7 million (2025)
- Stockholders’ Equity: \$2,379.4 million (2026), \$2,222.2 million (2025)
- Net (Decrease) in Cash: (\$729.2) million (2026 Six Months), (\$505.4) million (2025 Six Months)
5. Cash Flow Analysis
- Net Cash Provided by Operating Activities: \$138.8 million (2026 Six Months), \$156.9 million (2025 Six Months)
- Net Cash (Used in) Investing Activities: (\$141.7) million (2026 Six Months), (\$145.8) million (2025 Six Months)
- Net Cash Provided by Financing Activities: \$513.9 million (2026 Six Months), \$642.3 million (2025 Six Months)
6. Reconciliation of Adjusted Net Income Per Diluted Share
- Silgan provides adjusted net income calculations, which exclude certain costs and one-time items. For Q2 2026, the adjusted net income per diluted share is \$0.98, compared to \$0.92 for Q2 2025.
- For the six months ended June 30, adjusted net income per diluted share is \$1.83 (2026) vs \$1.74 (2025).
7. Forward-Looking Statements and Guidance
- Management’s statements contain forward-looking information, subject to risks and uncertainties such as those described in the company’s SEC filings.
- Estimated U.S. GAAP net income for 2026: \$111.6 million; for 2025: \$122.2 million.
- Estimated adjusted net income for 2026: \$76.9 million; for 2025: \$108.5 million.
- Estimated U.S. GAAP diluted EPS for 2026: \$1.05; for 2025: \$1.02.
- Estimated non-U.S. GAAP adjusted diluted EPS for 2026: \$1.07; for 2025: \$1.10.
8. Price Sensitive Items & Shareholder Considerations
- Significant Decrease in Cash and Cash Equivalents: The company’s cash position decreased substantially from \$955.7 million to \$351.5 million over the past year. This may indicate increased capital expenditures, acquisitions, or debt repayments, and could impact liquidity.
- Dividend Payments: Continued dividend payments at \$0.21 per share in Q2 2026 show commitment to shareholder returns.
- Segment Performance: All major segments (Dispensing and Specialty Closures, Metal Containers, Custom Containers) posted positive EBIT, with Dispensing and Specialty Closures leading.
- Adjusted vs. GAAP Earnings: Adjusted net income and EPS are higher than GAAP figures, suggesting exclusion of certain costs. Investors should review these adjustments closely for a more accurate picture of underlying performance.
- Guidance for 2026: The company expects slightly lower GAAP net income and EPS in 2026 compared to 2025, which could be price sensitive if below market expectations.
- Acquisition Costs: There are adjustments for acquisition-related costs, which may signal ongoing M&A activity.
9. Forward-Looking Risks
- Statements regarding future performance are subject to uncertainties, including risks outlined in Silgan’s Annual Report and other SEC filings.
10. Exhibits and Additional Information
- A copy of the press release dated July 29, 2026, is furnished as Exhibit 99.1.
Disclaimer: The information presented above is based on the latest available financial report from Silgan Holdings Inc. and includes forward-looking statements which are subject to change based on market conditions, management decisions, and external factors. Investors should refer to official SEC filings and consult with financial advisors before making investment decisions. This article is for informational purposes only and does not constitute investment advice.