Essex Property Trust, Inc. (ESS) Second Quarter 2026 Earnings: Detailed Investor Analysis
Key Financial Highlights
- Core FFO Growth: Core Funds from Operations (FFO) per diluted share increased by 1.2% year-over-year, coming in at \$4.08 for Q2 2026 versus \$4.03 in Q2 2025. For the first six months of 2026, Core FFO per share was \$8.15, up 1.9% from \$8.00 in the prior year period.
- Net Income Decline: Net income per diluted share for Q2 2026 was \$0.97, sharply lower than \$3.44 in Q2 2025. This decrease is primarily due to a gain on sale of real estate and land recognized in Q2 2025, not repeated in the current period.
- Same-Property Performance: Same-property revenue grew 2.7% year-over-year and 0.8% sequentially. Same-property Net Operating Income (NOI) increased 2.6% year-over-year and 1.2% sequentially, signaling strong operational management despite macroeconomic headwinds.
- Legal Settlements: The decrease in total FFO was primarily attributable to legal settlements, a non-core item that impacted reported results.
Capital Allocation and Liquidity
- Stock Repurchase Program: ESS repurchased 48,261 shares in Q2 2026 for \$11.7 million (average price \$242.47/share). Year-to-date repurchases totaled 254,001 shares for \$61.9 million (average price \$243.76/share).
- New Repurchase Authorization: In May 2026, the Board approved a new \$500 million stock repurchase plan, replacing the prior program. As of June 30, 2026, ESS had the full \$500 million of purchase authority remaining.
- Strong Liquidity Position: The Company reported approximately \$1.4 billion in liquidity, including unsecured credit facilities, cash, and marketable securities.
Investment Activity
- Co-Investment Disposition: Disposed of a co-investment apartment community at a total contract price of \$105.3 million (\$52.6 million at pro rata share).
- Structured Finance Redemptions: Received \$87.8 million from the full redemption of three structured finance investments.
- Preferred Equity Investments: Added investments in stabilized apartment communities totaling \$36.2 million (\$18.1 million at pro rata share), fully funded at closing, with an initial preferred return of 11.5%.
Revised Guidance and Outlook
- Revised Full-Year 2026 Core FFO Guidance: Raised midpoint of Core FFO per diluted share to \$16.14, up \$0.20 from prior guidance, representing 1.3% year-over-year growth.
- Same-Property Portfolio Growth: Updated guidance for same-property revenues to 2.8% (up 0.4%), operating expenses to 2.8% (down 0.25%), and NOI between 0.8% and 3.4%.
- Q3 2026 Core FFO Guidance: Midpoint set at \$3.99 per diluted share.
Price Sensitive: The upward revision in Core FFO guidance, strong liquidity, and new stock repurchase plan are likely to be viewed positively by investors and could impact the share price. The Company’s continued operational outperformance and robust capital management, despite legal settlements and a drop in net income (due to non-recurring items), reflect underlying strength and resilience.
Credit and Balance Sheet Metrics
- Debt and Capitalization: Debt to total assets stands at 34% versus a covenant of less than 65%. Secured debt is at 4% of total assets (well below the 40% covenant).
- Interest Coverage Ratio: At 508%, far above the minimum covenant of 150%.
- Unencumbered NOI: 93% of adjusted total NOI is unencumbered, reflecting a strong asset base and flexibility.
- Credit Ratings: Moody’s: Baa1, Stable outlook.
- Net Indebtedness to Adjusted EBITDAre: 5.4x, demonstrating manageable leverage.
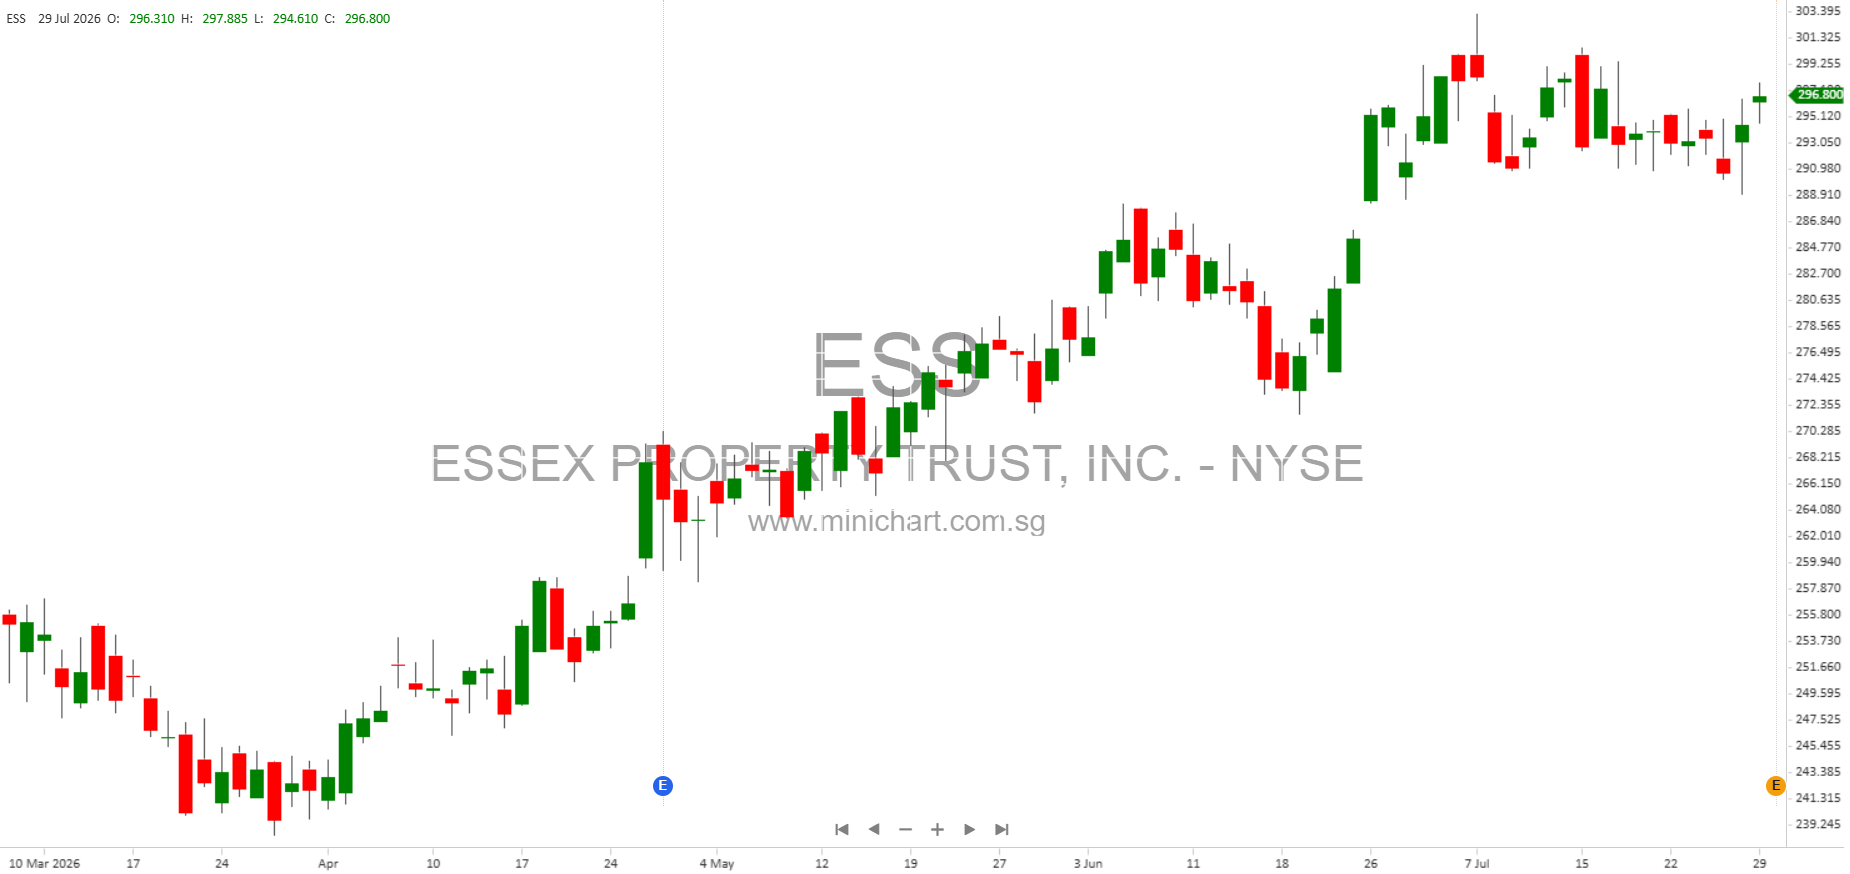
- Share Price: As of June 30, 2026, shares traded at \$291.59.
Other Notable Items
- Legal Settlements: General and administrative expenses include significant legal settlements, impacting reported FFO for the period.
- Political Advocacy Costs: \$0.1 million in Q2 2026 and \$1.7 million year-to-date, included in G&A expenses.
- Same-Property Operating Margin: Remains strong at 71%, consistent with prior quarters.
- Annualized Turnover: 40% in Q2 2026, up from 33% in Q1 2026.
- Risks: Forward-looking statements note risks including macroeconomic uncertainty, interest rate increases, inflation, possible recessionary impacts, regulatory changes, and competitive pressures. Legal settlements and non-core items may continue to impact results.
Investor Takeaways
- ESS continues to deliver resilient operational results, with Core FFO growth, strong same-property metrics, and robust liquidity.
- Shareholder value initiatives, including a new \$500 million repurchase authorization and prudent capital management, are significant positives.
- Upward guidance revision and successful investment activity may drive share price appreciation, although legal settlements and macro risks should be monitored.
Disclaimer
This article is for informational purposes only and does not constitute investment advice or a recommendation to buy or sell securities. All forward-looking statements are subject to risks and uncertainties that may cause actual results to differ materially from those expressed or implied. Investors should review Essex Property Trust’s SEC filings, including its Form 10-K and Form 10-Q, for more information and consult their financial advisor before making any investment decisions.