Fortrea Holdings Inc. Reports Q2 2026 Results: Raises Full-Year Guidance, Focuses on Growth and Margin Expansion
Key Highlights from the Second Quarter 2026 Report
- Revenues: \$678.2 million for Q2 2026, a decrease from \$710.3 million in Q2 2025.
- Book-to-Bill Ratio: 1.06x for the quarter; trailing 12 months at 1.12x, indicating robust new business wins.
- GAAP Net Loss: \$(13.2) million, or \$(0.14) per diluted share, a significant improvement from \$(374.9) million, or \$(4.14) per diluted share, in Q2 2025.
- Adjusted EBITDA: \$58.7 million (up from \$54.9 million in Q2 2025).
- Adjusted Net Income: \$22.7 million, or \$0.23 per diluted share (up from \$17.6 million, or \$0.19 per share, in Q2 2025).
- Backlog: \$7.8 billion as of June 30, 2026.
- Free Cash Flow: \$19.9 million in Q2 2026.
- Cash Provided by Operations: \$28.9 million for the quarter.
- Full-Year 2026 Guidance Raised:
- Revenue: \$2.62 billion to \$2.69 billion (previously lower range, exact prior figure not specified).
- Adjusted EBITDA: \$205 million to \$220 million (raised from earlier outlook).
CEO Commentary and Strategic Outlook
Anshul Thakral, CEO of Fortrea, emphasized the company’s ongoing progress in executing its strategy and delivering operational and financial excellence. He noted that Q2 marked the fourth consecutive quarter with a book-to-bill ratio above 1.0x—a key indicator of sustained demand and future revenue growth. Thakral credited the company’s global teams for building trusted client partnerships and supporting the advancement of important therapies for patients. Management remains focused on commercial execution, operational excellence, and financial discipline as Fortrea pursues sustainable growth and margin expansion.
Detailed Financial Performance
Quarterly Results
- Revenue: \$678.2 million in Q2 2026, down from \$710.3 million in Q2 2025, primarily due to prior period non-cash goodwill impairment charges impacting comparability.
- GAAP Net Loss: \$(13.2) million vs. \$(374.9) million Q2 2025 (the prior-year figure included a \$309.1 million non-cash goodwill impairment).
- Adjusted Net Income: \$22.7 million vs. \$17.6 million in Q2 2025.
- Adjusted EBITDA: \$58.7 million vs. \$54.9 million in Q2 2025.
- Book-to-Bill Ratio: 1.06x, reflecting strong order intake and supporting future revenue visibility.
First Half 2026 Results
- Revenue: \$1.31 billion, down from \$1.36 billion in H1 2025.
- GAAP Net Loss: \$(36.8) million (vs. \$(937.8) million in H1 2025, which included a \$797.9 million non-cash goodwill impairment).
- Adjusted Net Income: \$37.9 million, up from \$19.5 million in H1 2025.
- Adjusted EBITDA: \$105.7 million, up from \$85.2 million.
- Free Cash Flow: \$(5.1) million for the first half of 2026 (turning positive in Q2).
Balance Sheet and Cash Flow Position
- Cash and Cash Equivalents: \$168.6 million at June 30, 2026.
- Accounts Receivable and Unbilled Services: \$654.4 million.
- Total Assets: \$2.71 billion.
- Total Liabilities: \$2.19 billion.
- Total Equity: \$524.2 million.
- Operating Cash Flow: \$11.9 million for the first half of 2026, compared to \$(102.4) million in the first half of 2025, reflecting a turnaround in cash generation.
Key Items for Shareholders and Potential Share Price Impact
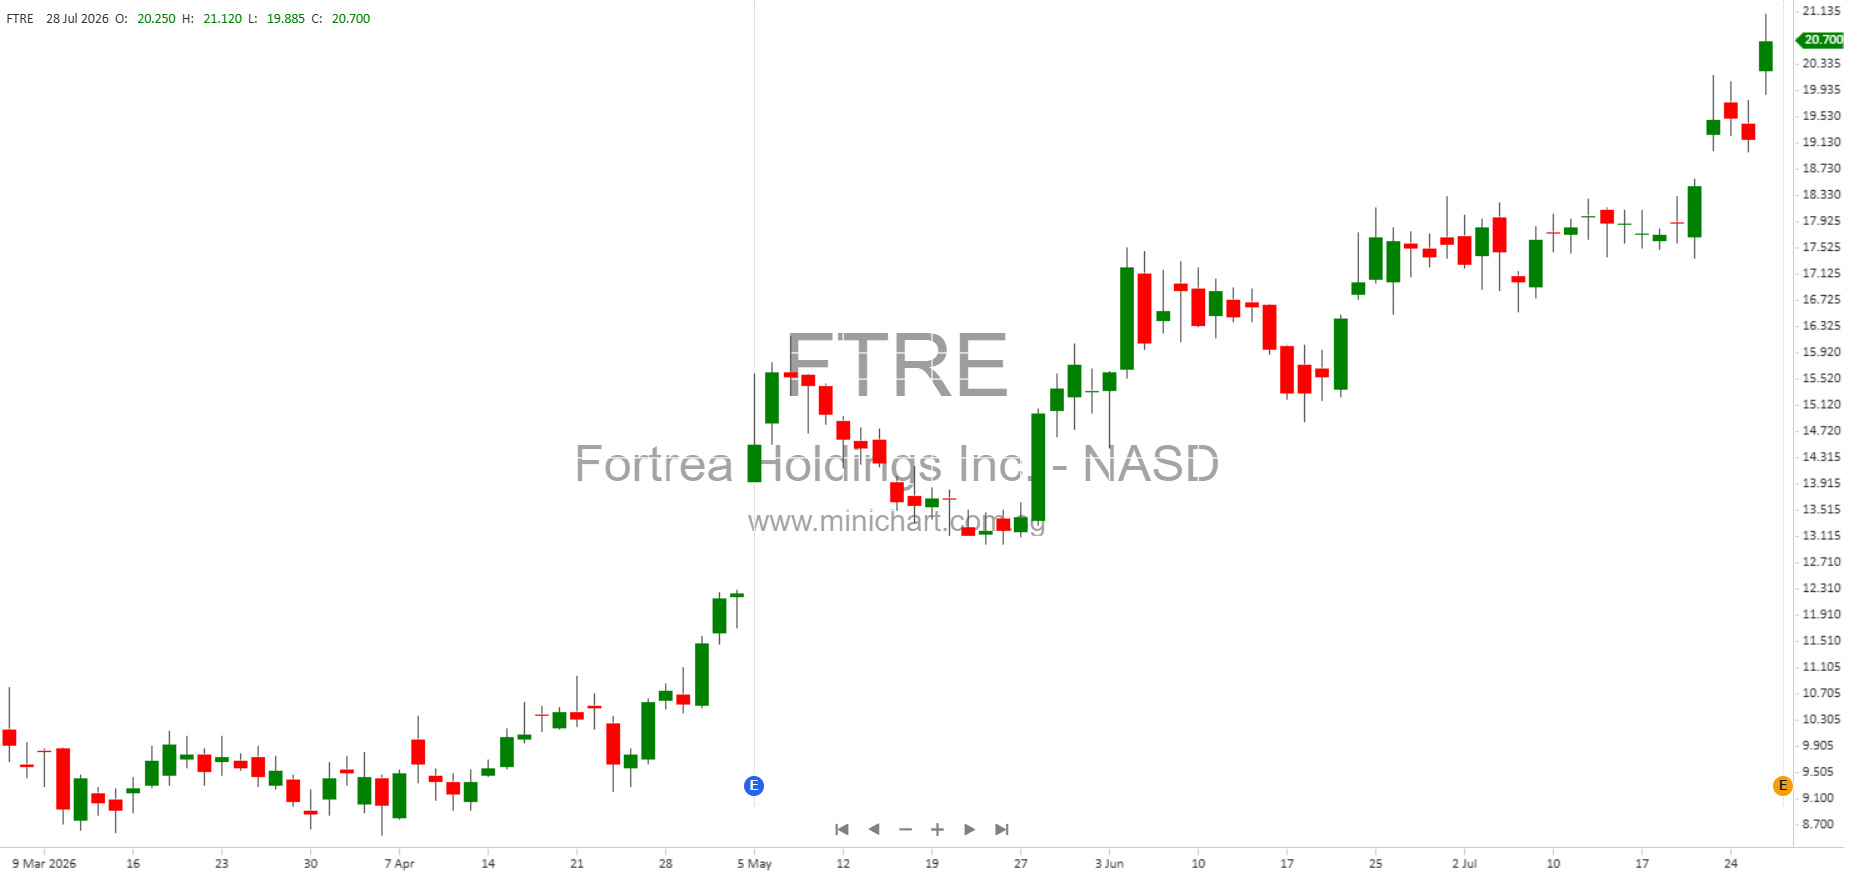
- Raised Guidance: The upward revision to full-year 2026 revenue and adjusted EBITDA guidance signals the management’s confidence in business momentum, which may be interpreted positively by the market.
- Sustained Book-to-Bill Ratio Above 1.0x: Four consecutive quarters above this key threshold underlines ongoing strong demand and supports future revenue growth.
- Significant Improvement in Adjusted Profitability: Both adjusted EBITDA and adjusted net income improved year over year, despite lower revenue, reflecting effective cost management and operational improvements.
- Reduction in GAAP Net Loss: The dramatic reduction in reported net loss (largely due to the absence of large goodwill impairments that impacted 2025 results) could alleviate investor concerns about long-term value erosion.
- Balance Sheet Stability: Cash holdings remain strong, with a modest decline in the quarter. Leverage and liquidity levels appear stable, supporting ongoing operations and potential investments.
- Free Cash Flow: Positive free cash flow in Q2 2026 (after a negative figure in H1 2026), if sustained, could be a catalyst for further investor confidence.
- Strategic Execution: Management’s continued focus on commercial execution and operational excellence, coupled with a pipeline of new business wins, positions the company for margin expansion and sustainable growth.
Additional Notes
- Non-GAAP Measures: The company continues to report adjusted EBITDA, adjusted net income, adjusted EPS, and free cash flow as supplemental non-GAAP measures. These exclude amortization of acquired intangibles, restructuring, stock compensation, and other one-time items. Investors should be aware that these figures are not directly comparable to GAAP results but are widely used in industry peer analysis.
- Risks: Fortrea highlights dependency on third parties, international operations, potential macroeconomic headwinds, and risks related to backlog conversion and customer concentration as ongoing risks to their outlook.
- Conference Call: Fortrea will host a call to discuss these results, providing an opportunity for further investor Q&A.
About Fortrea
Fortrea (Nasdaq: FTRE) is a leading global contract research organization (CRO) providing clinical trial management (phases I–IV), clinical pharmacology, and consulting services to the life sciences sector. The company leverages over three decades of experience, operates in about 100 countries, and partners with both emerging and large biopharma, biotech, medical device, and diagnostics companies.
Disclaimer: This article is provided for informational purposes only and does not constitute investment advice or a recommendation to buy or sell any securities. Investors should conduct their own due diligence and consult with financial advisors before making investment decisions. All forward-looking statements are subject to risks and uncertainties as outlined by Fortrea Holdings Inc. in its filings with the U.S. Securities and Exchange Commission.