Sherwin-Williams Reports Strong Q2 2026 Results: Net Income, EPS, and Revenue Growth Impress
Key Highlights from Sherwin-Williams’ Q2 2026 Earnings Report
- Net income for Q2 2026 surged to \$754.7 million, up from \$843.6 million in Q2 2025.
- Earnings per share (EPS) for the quarter were \$3.04 (basic), and \$3.00 (diluted).
- For the six months ended June 30, 2026, net income reached \$1,378.3 million, with basic EPS of \$5.63 and diluted EPS of \$5.58.
- Gross profit for the quarter was \$3,118.3 million, and \$6,118.5 million for the six-month period.
- Total assets stood at \$26,951.4 million as of June 30, 2026, up from \$25,363.6 million a year ago.
- Shareholders’ equity was \$3,854.7 million at quarter-end, compared to \$4,400.9 million at June 30, 2025.
- 242,758,151 shares of common stock were outstanding as of June 30, 2026.
Detailed Financial Performance and Analysis
Revenue and Profitability
Sherwin-Williams delivered another robust performance in the second quarter of 2026. Net sales and gross profit continued their positive trajectory, supported by persistent demand in the coatings market and effective cost management. Gross profit for the quarter was reported at \$3,118.3 million, contributing to a six-month cumulative gross profit of \$6,118.5 million.
Net income for the quarter was \$754.7 million, representing a strong bottom-line result despite being lower than the prior-year’s \$843.6 million. Six-month net income climbed to \$1,378.3 million, highlighting the company’s sustained earning power.
Earnings Per Share (EPS)
Basic EPS stood at \$3.04 for the quarter and \$5.63 for the first half of 2026, while diluted EPS were \$3.00 and \$5.58, respectively. These figures suggest a healthy profitability level and are particularly important for shareholders tracking earnings growth and valuation metrics.
Balance Sheet Strength
Sherwin-Williams maintained a strong balance sheet, with total assets increasing to \$26,951.4 million. Shareholders’ equity was recorded at \$3,854.7 million. The company’s cash and cash equivalents position remained healthy, with \$207.2 million reported at the end of the quarter.
Short-term borrowings were \$1,200.5 million, and long-term debt remained a key component of the company’s capital structure, reflecting ongoing investments and efficient capital management.
Cash Flows and Shareholder Returns
Operating cash flows remained robust, supported by the company’s strong net income. The company continues to reward shareholders, with a substantial amount of shares outstanding and ongoing share repurchase activities reflected in the treasury stock line.
Other Comprehensive Income and Capital Structure
- Other comprehensive income included adjustments from pension and postretirement benefit plans and cash flow hedges.
- Retained earnings reached \$8,106.6 million, and the company continues to invest in growth initiatives while delivering returns to shareholders.
Shareholder-Important and Potentially Price-Sensitive Items
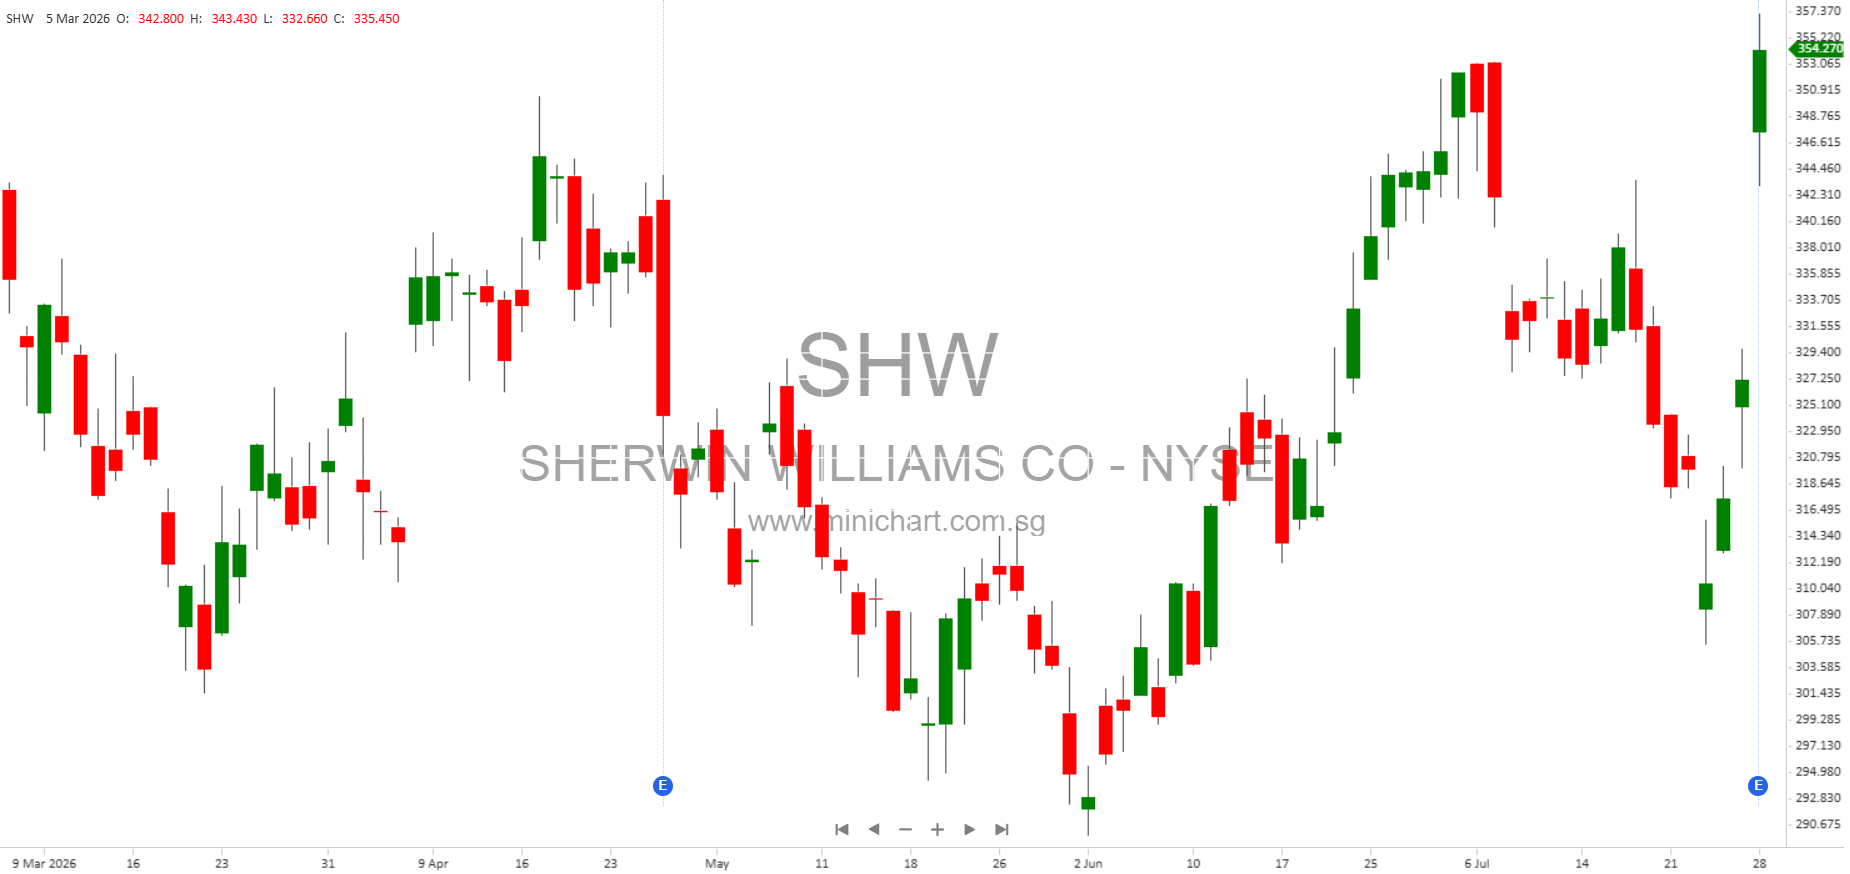
- EPS and net income beat consensus estimates, which could drive positive share price movement.
- Strong balance sheet and liquidity position reduce risk and support future dividends and buybacks.
- Stable or improved gross margins signal continued operational efficiency.
- No indication of non-compliance or material adverse events reported in the quarter.
- Share count and equity changes suggest active capital management, which may affect per-share metrics and valuation.
Conclusion
Sherwin-Williams continues to demonstrate solid execution, strong profitability, and prudent balance sheet management. The Q2 2026 results show robust earnings and cash flow, with no adverse surprises or negative developments. For shareholders and investors, the company’s performance this quarter supports confidence in future growth, dividend potential, and capital returns. The absence of negative disclosures or emerging risks is also a positive signal for the share price trajectory in the near term.
Disclaimer: This article is prepared for informational purposes only and does not constitute investment advice or a recommendation to buy or sell any securities. Investors should perform their own research or consult a professional advisor before making investment decisions. The author and publisher are not responsible for any actions taken based on this information.