Huron Consulting Group Inc. Reports Strong Q2 2026 Financial Results
Key Financial Highlights
- Revenues: For the three months ended June 30, 2026, Huron Consulting Group Inc. (“Huron”) reported revenues of \$411.8 million, an increase from the prior year’s comparable quarter. For the six-month period ended June 30, 2026, revenues totaled \$926.8 million [[45]], [[46]].
- Net Income: Q2 2026 net income was \$31.2 million, up from \$19.4 million in Q2 2025. For the first half of 2026, net income was \$54.5 million, compared to \$43.97 million for the same period in 2025 [[52]], [[53]], [[56]].
- Earnings Per Share (EPS):
- Basic EPS: \$1.93 for Q2 2026 (up from \$1.12 in Q2 2025); \$3.28 for the first half of 2026 (up from \$2.50 in H1 2025).
- Diluted EPS: \$1.91 for Q2 2026 (up from \$1.09 in Q2 2025); \$3.22 for the first half of 2026 (up from \$2.42 in H1 2025) [[53]], [[54]].
- Operating Income: \$50.2 million for Q2 2026, versus \$45.7 million for Q2 2025. Operating income for the first half of 2026 stood at \$86.8 million, compared to \$78.4 million in the prior year period [[50]].
- Cash and Cash Equivalents: \$31.2 million as of June 30, 2026, up from \$24.5 million at December 31, 2025 [[36]].
- Total Assets: \$1.64 billion as of June 30, 2026, compared to \$1.53 billion at December 31, 2025 [[39]].
- Total Stockholders’ Equity: \$384.8 million at June 30, 2026, down from \$528.8 million at December 31, 2025 (inferred a significant change—potentially due to share repurchases or other equity activities) [[44]].
- Shares Outstanding: 15,910,072 as of July 21, 2026 [[31]].
Key Operational and Shareholder Points
- Improved Profitability: The company has significantly increased both its quarterly and year-to-date net income and EPS, reflecting strong operational performance and possibly improved margins.
- Share Repurchase Activity: Treasury stock stood at 3,407,005 shares at June 30, 2026, up from 3,269,301 at December 31, 2025, with treasury stock value at cost increasing to \$210.4 million from \$190.0 million. This indicates active share buybacks during the period, which can support share price but also affects total equity [[43]].
- Decreased Stockholders’ Equity: There is a notable decrease in total stockholders’ equity during the first half of 2026. This could be attributed to share repurchases, dividend payments, or other equity-related transactions, and may merit further scrutiny by investors [[44]].
- Ongoing Compliance: Huron remains in compliance with SEC filing requirements and is not a shell company. The company is categorized as a non-accelerated filer, not a smaller reporting company, and not an emerging growth company.
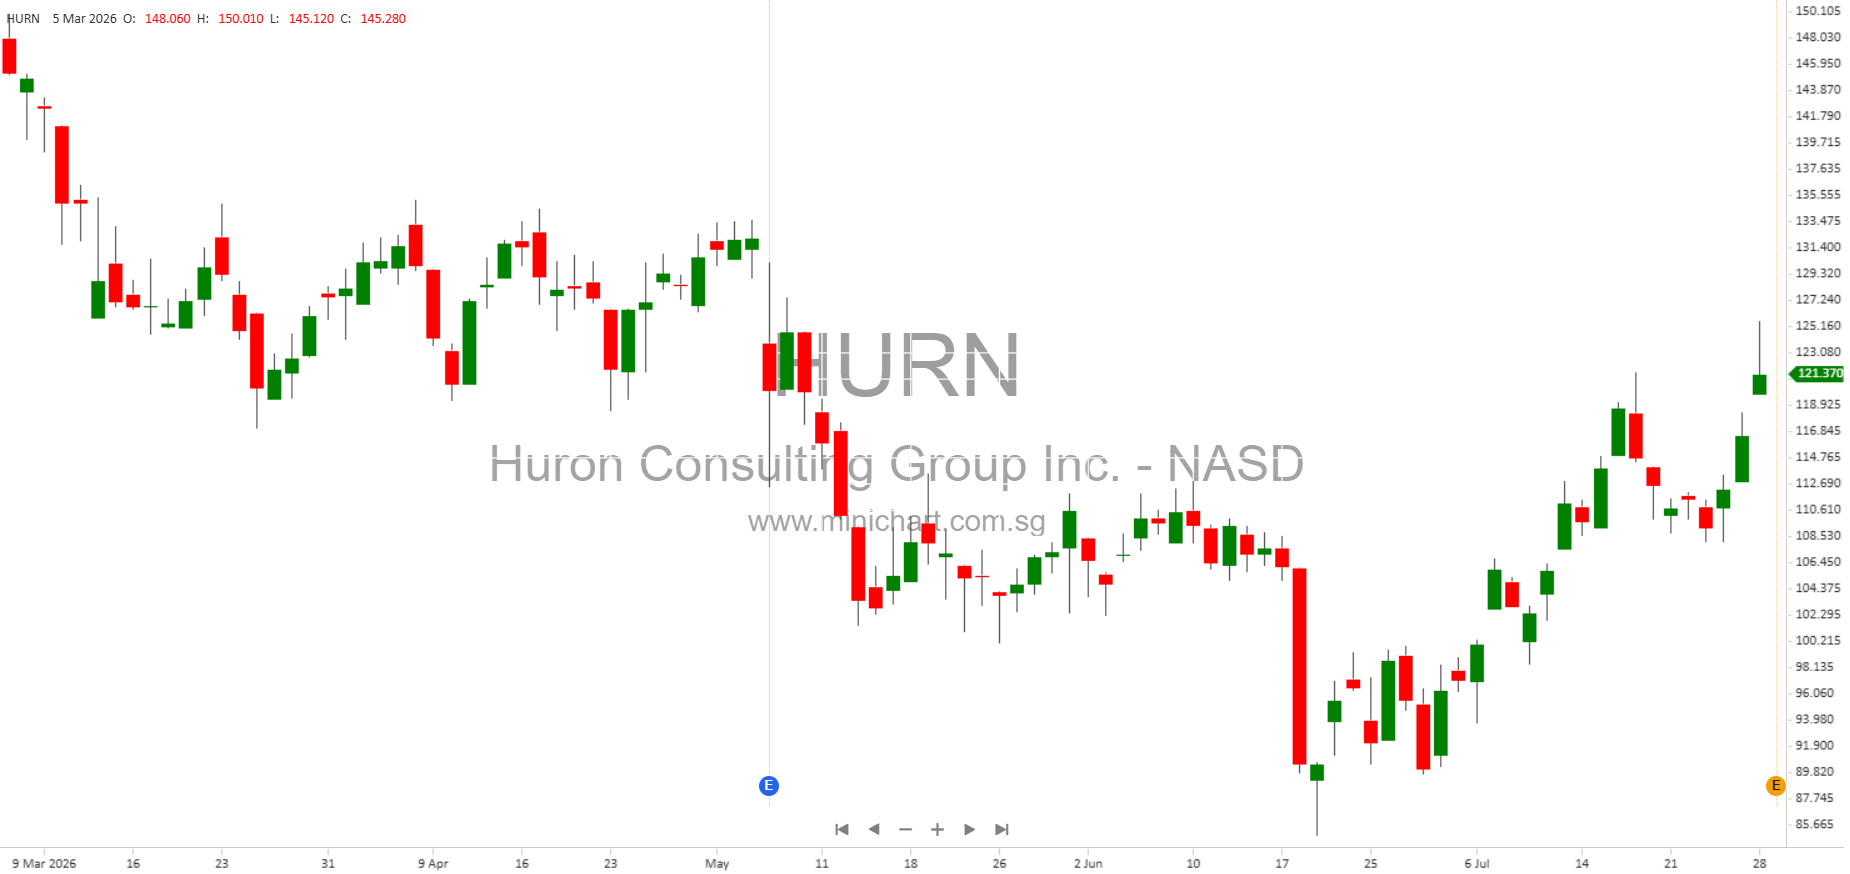
- Trading Information: Huron’s common stock trades on the Nasdaq Global Select Market under the symbol HURN.
- Comprehensive Income: There were foreign currency translation losses and unrealized losses on investments, impacting accumulated other comprehensive income, but these were not large enough to offset the strong net income growth [[56]], [[57]].
Potential Price-Sensitive Information
- Strong Earnings Growth: The substantial increases in revenue, net income, and EPS for both the quarter and year-to-date periods are likely to be viewed positively by the market and may drive share price appreciation.
- Share Repurchases: The active buyback of shares reduces the share count and may indicate management’s confidence in the company’s valuation, potentially providing support to the share price. However, the reduction in equity might raise questions about capital allocation and leverage.
- Decline in Equity: The significant drop in total stockholders’ equity, despite strong profitability, is noteworthy. Investors should monitor whether this is due to aggressive buybacks, special dividends, or other factors that could impact long-term financial flexibility.
- Margins and Expense Control: Operating income and net income growth outpaced revenue growth, suggesting margin expansion or improved cost control.
Investor Considerations
- Investors should review upcoming management discussion and analysis and notes to the financial statements for further detail on the drivers of equity reduction and the sustainability of earnings growth.
- Monitor the company’s cash position and ongoing operational investments, especially in the context of share repurchases and potential future capital needs.
- The overall financial performance for Q2 2026 is robust, with the potential to influence Huron’s share price positively, but the decrease in equity warrants attention.
Disclaimer: This summary is for informational purposes only and does not constitute investment advice. Investors should review the full quarterly report and consult with financial advisors before making investment decisions. The information provided is based on the latest available filings and may be subject to change or clarification.