TransUnion Q2 2026 Earnings Report: Key Highlights for Investors
Overview
TransUnion has released its unaudited financial results for the quarter ended June 30, 2026, providing a comprehensive view of its financial position and performance. Below is an in-depth analysis of the key highlights, important metrics, and critical issues that shareholders and potential investors should closely review.
Key Financial Highlights
- Total Assets: \$12.19 billion as of June 30, 2026, up from \$11.11 billion at the end of December 2025, reflecting a healthy balance sheet expansion.
- Total Liabilities: \$6.57 billion, representing a stable leverage position.
- Total Stockholders’ Equity: \$4.84 billion attributable to TransUnion shareholders, plus \$155.7 million attributable to noncontrolling interests, leading to a combined equity of \$4.99 billion.
- Cash and Cash Equivalents: \$839.1 million at June 30, 2026, compared to \$853.6 million at the end of 2025, indicating strong liquidity.
- Common Stock Outstanding: 191.6 million shares as of June 30, 2026.
- Net Income (Q2 2026): \$146.7 million for the quarter ended June 30, 2026, and \$547.2 million for the six months ended June 30, 2026.
- Net Income Attributable to TransUnion (Q2 2026): \$109.6 million for the quarter, and \$540.5 million for the half-year.
- Diluted Earnings per Share (Q2 2026): \$0.74 for the quarter, and \$2.78 year-to-date.
- Operating Income: \$192.2 million for the quarter, and \$502.8 million for the first half of 2026.
- Comprehensive Income (including noncontrolling interests): \$200.4 million for the quarter, and \$320.8 million for the half-year.
- Retained Earnings: \$2.78 billion as of June 30, 2026.
- Treasury Stock: \$402.5 million at cost, indicating share repurchases.
- Weighted-Average Diluted Shares Outstanding (Q2 2026): 194.3 million.
Important Shareholder Considerations
- Consistent Profitability: TransUnion continues to show strong profitability, with net income and earnings per share both increasing from the prior year. This may boost investor confidence and support share price appreciation.
- Stock Repurchase Activity: The company has a significant amount of treasury stock, indicating ongoing share buybacks. This can be shareholder-friendly as it reduces share count, potentially increasing EPS and supporting the stock price.
- Dividend and Retained Earnings: The report does not specifically mention dividends, but the increase in retained earnings may signal capacity for future dividend increases or further share buybacks.
- Comprehensive Income Volatility: There were significant movements in other comprehensive income, particularly from foreign currency translation and cash flow hedges. These items, while non-cash, can impact book value and investor sentiment.
- No Preferred Stock Outstanding: TransUnion has no preferred shares outstanding, indicating no dilution risk from this source.
- Regulatory Compliance: The company remains fully compliant with SEC filing requirements and is not a shell company or an emerging growth company, which may reassure institutional investors.
- Exchange Listing: Shares are registered and traded on the New York Stock Exchange, ensuring liquidity and visibility.
Potential Share Price Drivers
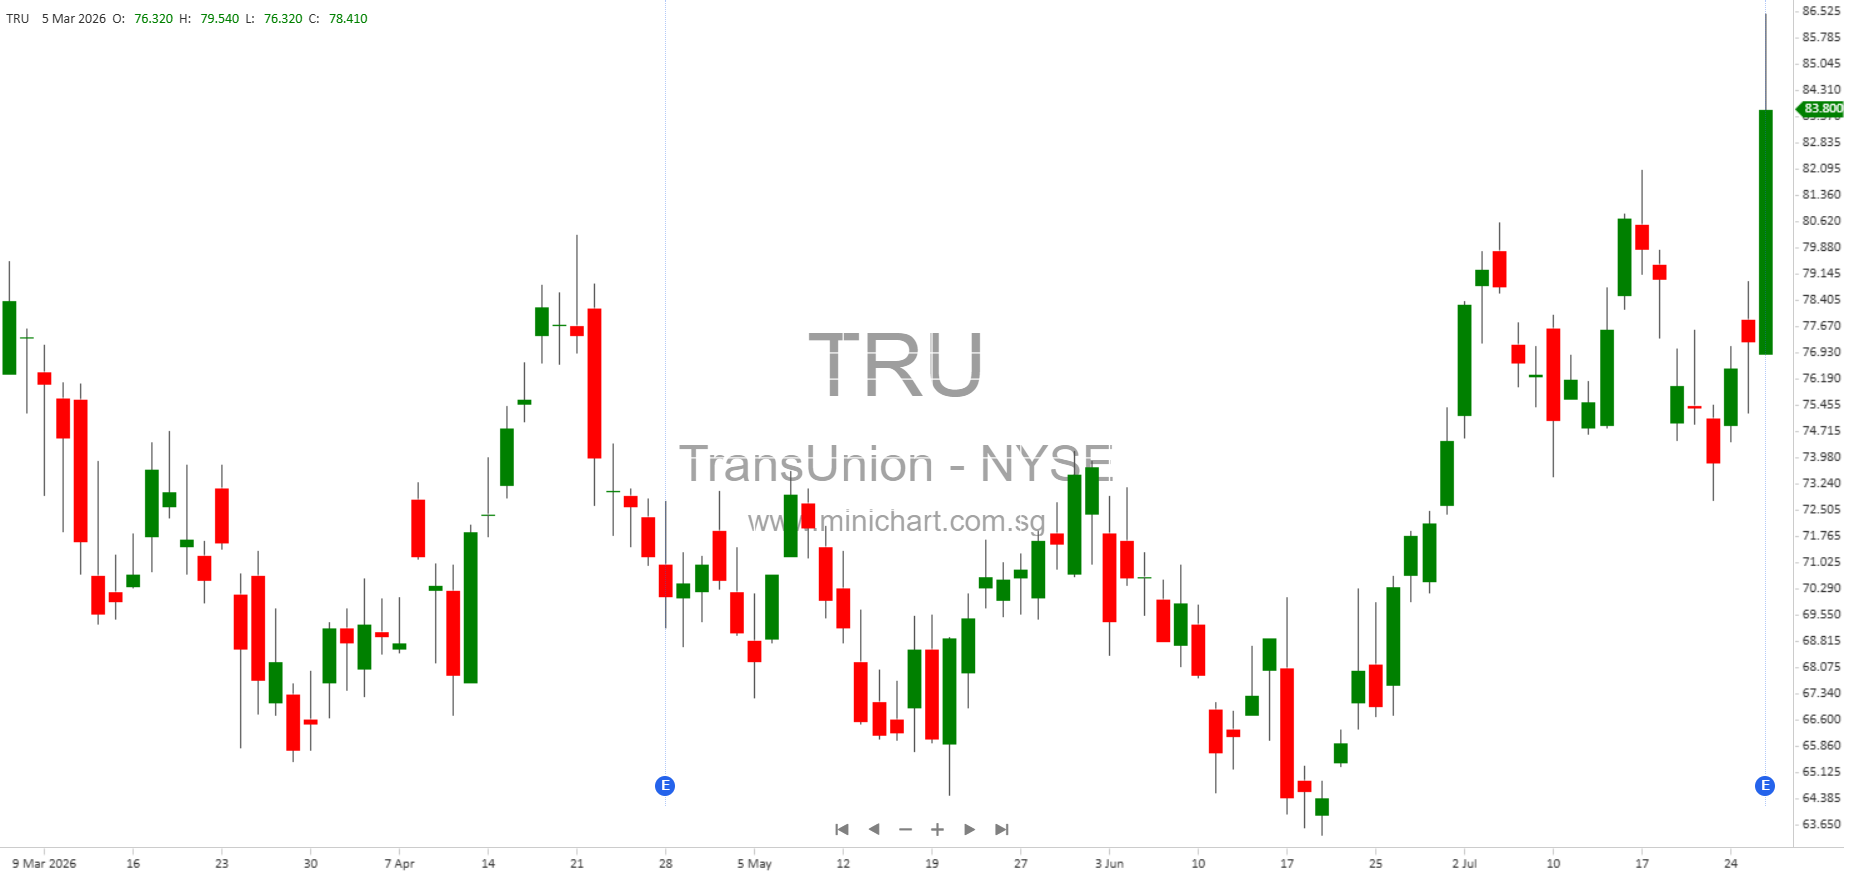
- Strong Earnings Growth: The jump in net income and EPS, particularly on a diluted basis, is likely to be viewed positively by the market, supporting the stock price.
- Balance Sheet Expansion: Growth in total assets and equity may be interpreted as a signal of underlying business growth.
- Share Repurchases: Ongoing buybacks can reduce share count and may lead to higher EPS in the future, which is often seen as a positive catalyst.
- Foreign Currency and Derivatives Impact: Notably, comprehensive income was impacted by foreign currency translation adjustments and cash flow hedge activities. Large swings in these items could introduce volatility to reported equity and may be closely watched by analysts.
Other Noteworthy Details
- No Preferred Stock Issuance: 100 million preferred shares are authorized, but none are issued or outstanding, preserving capital structure flexibility.
- Authorized Shares: 1 billion common shares are authorized, with 199 million issued and 191.6 million outstanding, suggesting a meaningful buyback program or restricted shares.
- Noncontrolling Interests: The decline in noncontrolling interests (from \$155.7 million to \$106.1 million) may reflect changes in subsidiaries or affiliate structures, which investors may want to monitor for potential divestitures or buyouts.
Conclusion
TransUnion delivered a robust quarter with strong earnings, ongoing share buybacks, and a solid balance sheet. The company’s continued profitability, prudent capital management, and lack of dilution risk from preferred or new common stock issuance are all positives for shareholders. However, investors should remain attentive to the impacts of foreign currency movements and derivative exposures on comprehensive income. Overall, the results contain several elements that could positively influence the share price, especially if the company continues to execute on its growth and capital return strategies.
Disclaimer: This article is for informational purposes only and does not constitute investment advice. Investors should review the full quarterly report and consult with their financial advisors before making any investment decisions. The information presented herein is based on public filings and may be subject to change or revision.