Key Financial Highlights
- Net Income: \$87.1 million for Q2 2026, with diluted earnings per share (EPS) and adjusted diluted EPS (non-GAAP) both at \$0.94.
- Six Months Performance: Net income for the first half of 2026 reached \$175.3 million, with diluted EPS of \$1.88.
- Net Interest Income: \$227.7 million (fully tax equivalent basis) for the quarter, down \$0.8 million from the previous quarter.
- Net Interest Margin: 3.83% (fully tax equivalent basis), down 4 basis points linked quarter. Adjusted net interest margin (non-GAAP) remained flat at 3.61%.
- Deposit Costs: Cost of total deposits rose to 1.96%, up 2 basis points from Q1.
- Loan Growth: Loans increased by \$220.9 million linked quarter, a 4.7% annualized net loan increase. This includes a \$58.3 million portfolio acquired by Republic Business Credit, a Renasant Bank subsidiary.
- Securities: Securities increased by \$9.3 million; \$162.4 million in securities purchased during the quarter, offset by a \$69.2 million negative fair market value adjustment and principal payments, calls, and maturities totaling \$146.5 million.
- Deposits: Deposits decreased \$398.4 million, primarily due to seasonal outflows in public fund deposits (\$367.7 million). Noninterest-bearing deposits fell \$145.4 million, representing 23.2% of total deposits.
- Capital Metrics: Book value per share increased 1.7% and tangible book value per share (non-GAAP) increased 1.4% linked quarter.
- Dividend and Stock Repurchases: Dividend increased to \$0.24 per share effective April 28, 2026. The company repurchased \$60.0 million of common stock at an average price of \$39.54 during the quarter; \$101.8 million in repurchase authorization remains available.
- Subordinated Debt Offering: On May 7, 2026, Renasant issued \$300.0 million of 6.25% Fixed-to-Floating Rate Subordinated Notes due 2036.
Credit Quality Overview
- Provision for Credit Losses: \$1.2 million on loans and \$2.6 million on unfunded commitments, both representing decreases linked quarter.
- Allowance for Credit Losses: Ratio stood at 1.54% of total loans, down 2 basis points linked quarter.
- Coverage Ratio: Allowance for credit losses to nonperforming loans improved to 158.73% from 147.71% last quarter.
- Net Loan Charge-Offs: \$2.8 million, or 0.06% annualized.
- Nonperforming Loans: Down to 0.97% of total loans from 1.06% in Q1.
- Criticized Loans: Decreased to 2.66% of total loans from 2.77% in Q1.
Performance Ratios & Other Metrics
- Return on Average Assets: 1.30% for Q2 2026 (GAAP); adjusted return was 1.30% (non-GAAP).
- Return on Average Tangible Assets: 1.48% (non-GAAP).
- Return on Average Equity: 9.07% (GAAP); adjusted return was 9.07% (non-GAAP).
- Return on Average Tangible Equity: 16.25% (non-GAAP).
- Efficiency Ratio: 57.92% (GAAP); adjusted efficiency ratio was 54.92% (non-GAAP).
- Tangible Common Equity Ratio: 9.10% (non-GAAP).
Balance Sheet Snapshot as of June 30, 2026
- Total Assets: \$27.0 billion
- Total Deposits: \$21.7 billion
- Loan Portfolio: \$19.2 billion, with significant growth in commercial real estate and commercial/industrial segments.
- Shareholder Equity: \$3.87 billion
- Shares Outstanding: 91.4 million
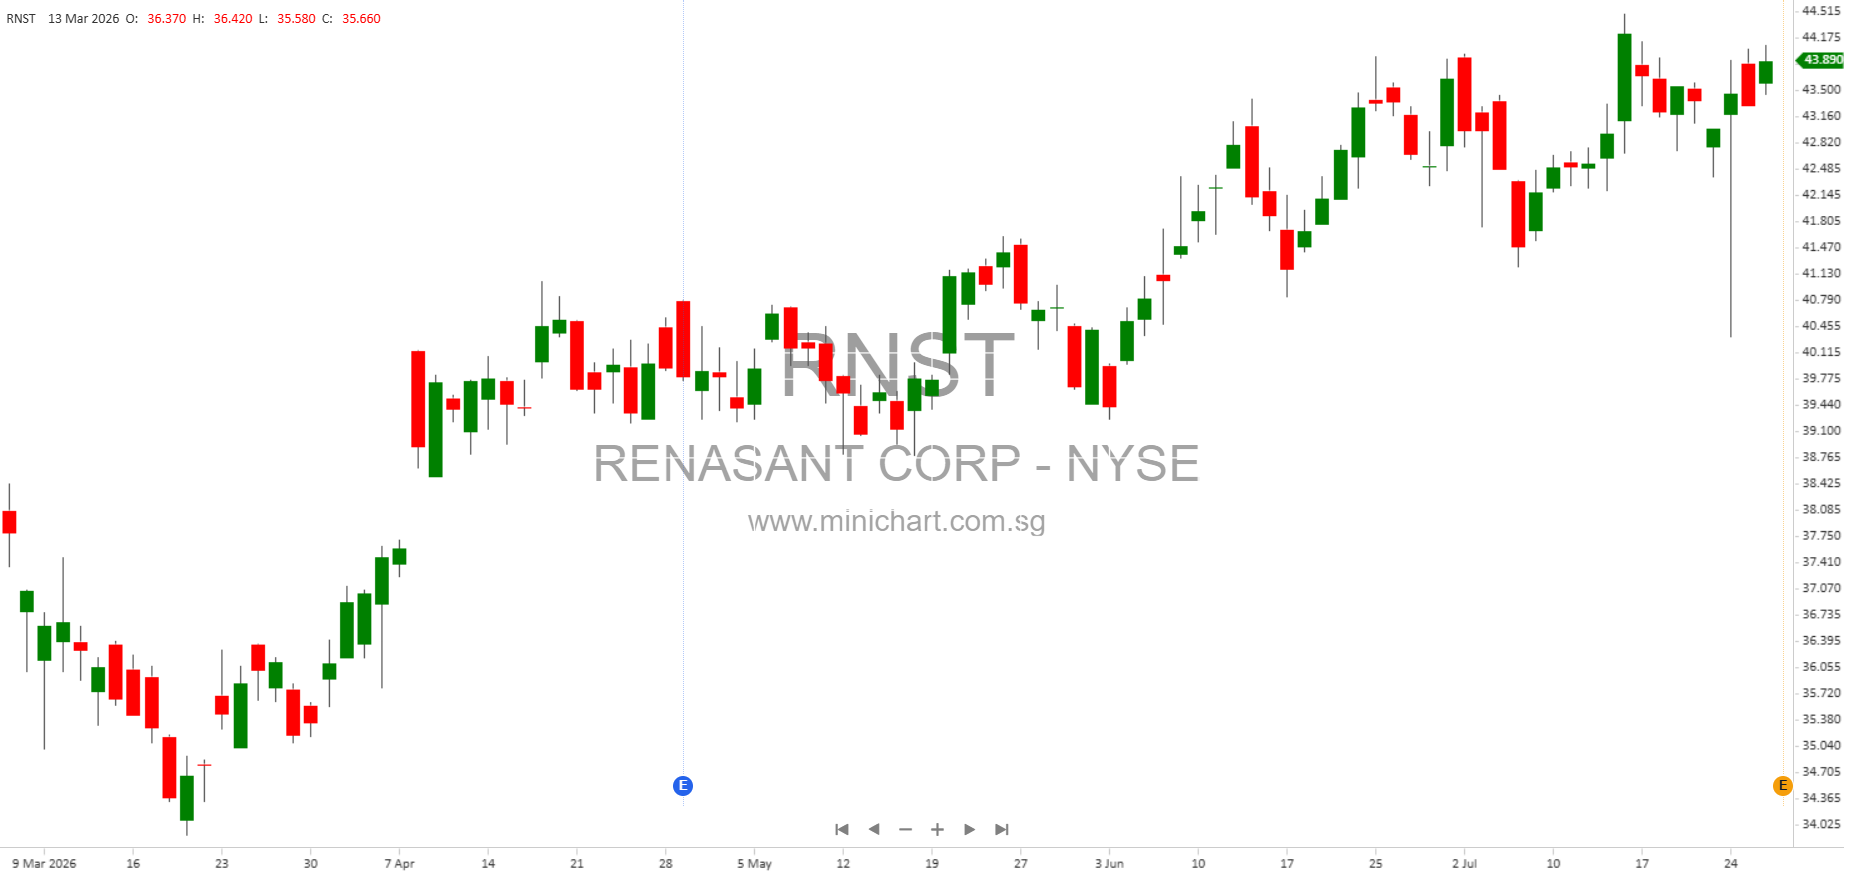
- Market Value Per Share: \$42.54
- Book Value Per Share: \$42.35; Tangible Book Value Per Share: \$25.34 (non-GAAP)
Noninterest Income & Expense
- Noninterest Income: \$51.2 million for Q2, up \$0.9 million linked quarter. Includes service charges, fees and commissions, wealth management revenue, mortgage banking income, BOLI income, and other.
- Noninterest Expense: \$161.5 million for Q2, up \$6.2 million linked quarter. Increase driven by deferred compensation accruals, higher health insurance claims, and annual merit increases.
- Mortgage Division: Generated \$611.6 million in interest rate lock volume, up \$69.3 million linked quarter; gain on sale margin was 1.57%, down 28 basis points.
Shareholder-Sensitive and Price-Moving Information
- Dividend Increase: The dividend was raised to \$0.24 per share, reflecting confidence in cash flow and capital strength. This is typically a positive signal for shareholders.
- Stock Repurchase Program: \$60 million was spent on repurchases in Q2, with over \$101 million authorization remaining. Share buybacks can support share prices and signal management’s belief in undervaluation.
- Subordinated Debt Offering: Successful completion of \$300 million debt offering at 6.25% rate—strengthens balance sheet and provides future growth capital.
- Deposit Decline: Large decrease in deposits (\$398.4 million), mainly due to seasonal outflows in public funds. While explained as seasonal, it’s a metric investors should monitor in coming quarters.
- Improved Credit Quality: Nonperforming loans and criticized loans declined, and coverage ratios improved. This suggests lower credit risk and potential for lower future provisions, supporting earnings.
- Material Weakness in Internal Controls: The company disclosed a material weakness in internal controls over financial reporting (identified in the 2025 Annual Report). Investors should be aware of this risk, though remediation efforts are underway.
- Forward-Looking Risks: Management cautioned on risks including integration of acquisitions, economic conditions, competitive pressures, regulatory changes, cyber and fraud risks (including AI-driven threats), and other market uncertainties.
Additional Investor Details
- Conference Call: A webcast and conference call for analysts took place on July 29, 2026. Replay is available until August 12, 2026.
- Non-GAAP Measures: Multiple non-GAAP metrics are used for performance evaluation. Investors should review reconciliations to GAAP provided in the report for clarity.
- Growth Strategy: Management expressed optimism about continued profitability and growth opportunities across its footprint.
Conclusion
Renasant Corporation’s Q2 2026 results reflect strong financial performance and improving credit quality. The dividend hike, substantial share repurchases, and successful debt offering all indicate robust capital management and shareholder-friendly actions. Investors should closely monitor deposit trends, internal control remediation, and competitive risks as outlined by management. With improving profitability metrics and a positive outlook, these results are potentially price-sensitive and could impact RNST’s share value in the near term.
Disclaimer
This article is for informational purposes only and does not constitute investment advice. All financial data and performance metrics are based on Renasant Corporation’s official second quarter 2026 earnings release. Investors should conduct their own due diligence and consult with a financial advisor before making investment decisions. Forward-looking statements are subject to risks and uncertainties, and actual results may differ materially from those expressed or implied. The author assumes no responsibility or liability for any actions taken based on this information.