Trustmark Corporation Q2 2026 Financial Results: Detailed Update for Investors
Key Highlights and Investor Insights
- Net Income Surges: Trustmark Corporation reported a net income of \$63.5 million for the quarter ended June 30, 2026, marking a 13.2% increase from \$56.1 million in the previous quarter, and a 13.8% increase year-over-year from \$55.8 million.
- Earnings Per Share (EPS) Growth: Basic earnings per share rose to \$1.09 (up 14.7% quarter-over-quarter and 18.5% year-over-year). Diluted EPS also increased to \$1.08, reflecting a 13.7% increase from the prior quarter and 17.4% year-over-year.
- Dividend Consistency: The company maintained its dividend at \$0.25 per share, consistent with the prior quarter, and up slightly from \$0.24 a year ago.
- Strong Return Ratios: Return on average equity improved to 11.88%, while return on average tangible equity reached 14.08%. Return on average assets increased to 1.33%.
- Net Interest Margin Remains Robust: The interest margin (yield, FTE) remained steady at 5.47%, with a cost of 1.63%.
- Asset and Capital Strength:
- Total assets grew 1.1% sequentially to \$18.99 billion, up 3.1% year-over-year.
- Total shareholders’ equity increased to \$2.14 billion.
- Capital ratios remain solid: Total equity to assets at 11.17%, tangible equity to tangible assets at 9.59%, and Common Equity Tier 1 capital ratio at 11.87%.
- Credit Quality Stable: Nonaccrual loans as a percentage of loans held for investment (LHFI) plus loans held for sale (LHFS) stand at 0.35%, down significantly from 0.68% last year. Nonperforming assets have also declined to 0.39% of LHFI plus LHFS.
- Asset Mix and Growth:
- Securities available for sale grew 10.1% year-over-year to \$1.92 billion.
- Loans held for investment (LHFI) grew to \$13.9 billion, up 4.2% year-over-year.
- Total earning assets increased 3.6% year-over-year to \$17.62 billion.
- Operating Performance: Net interest income (FTE) for the quarter was \$168.6 million, up 4.4% year-over-year. Noninterest income and expenses remained stable, with a notable gain of \$3.27 million from the sale of Visa A shares during the period.
Important Shareholder Information & Price Sensitive Insights
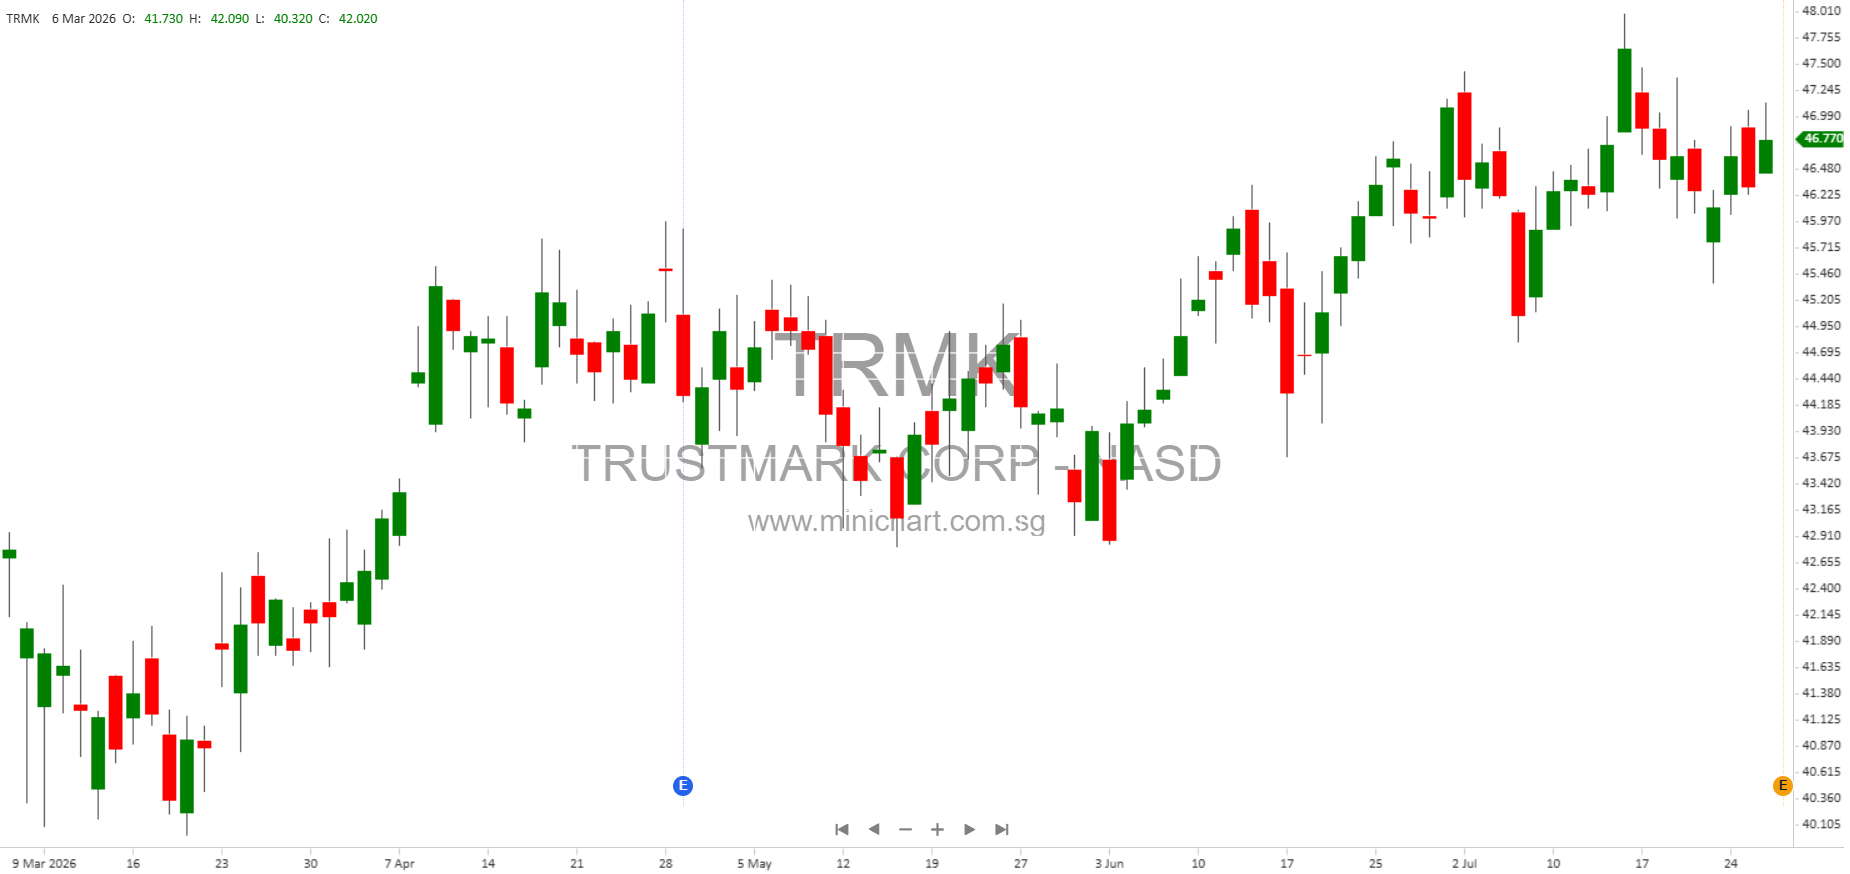
- Strong Earnings and Capital Position: The healthy rise in net income and EPS, combined with strong capital ratios, may bolster investor confidence and support share price appreciation.
- Improving Credit Quality: The significant decline in nonaccrual and nonperforming assets signals effective credit risk management, potentially reducing future loan loss provisions.
- Stable Dividend Policy with Growth Potential: The continued payment of dividends and EPS growth may appeal to income-focused investors and could be interpreted as a sign of management’s confidence in sustained performance.
- Asset Growth and Margin Management: The company’s ability to grow loans and securities while maintaining a robust net interest margin is a positive indicator for future earnings streams.
- Risk Factors Remain: Management highlights several risks that could impact future results, including Federal Reserve monetary policy, economic and real estate market conditions, changes in credit quality, cyber-attacks, integration costs from acquisitions, regulatory changes, and potential market effects from the U.S. presidential administration’s policies. Any materialization of these risks could negatively impact earnings and share value.
- Non-GAAP Measures: The company uses several non-GAAP financial measures (such as tangible common equity ratios and operating earnings), which are widely used by analysts for comparison but are not standardized. Investors should review these in conjunction with GAAP results.
- Conference Call Details: Trustmark will host a conference call with analysts on July 29, 2026, at 8:30 a.m. Central Time. A replay will be available for those who cannot attend live.
Comprehensive Financial Data (Q2 2026)
| Metric | Q2 2026 | Q1 2026 | Q2 2025 | QoQ Change | YoY Change |
|---|---|---|---|---|---|
| Net Income (\$M) | 63.5 | 56.1 | 55.8 | +13.2% | +13.8% |
| Basic EPS (\$) | 1.09 | 0.95 | 0.92 | +14.7% | +18.5% |
| Tangible Equity / Tangible Assets | 9.59% | 9.62% | 9.50% | -0.03 pts | +0.09 pts |
| Return on Average Assets | 1.33% | 1.20% | 1.21% | +0.13 pts | +0.12 pts |
| Net Interest Margin (FTE) | 5.47% | 5.47% | 5.66% | — | -0.19 pts |
| Nonaccrual Loans / (LHFI + LHFS) | 0.35% | 0.68% | 0.68% | -0.33 pts | -0.33 pts |
Forward-Looking Statements and Risks
Trustmark’s management remains optimistic but highlights several uncertainties that may impact future results, including interest rate changes by the Federal Reserve, economic and market volatility, credit and real estate market conditions, cyber-security threats, integration of acquisitions, and global uncertainties such as pandemics or political developments. The occurrence of any such events could materially affect Trustmark’s operations and share price.
Conclusion
Trustmark Corporation’s strong Q2 2026 results, significant improvement in earnings, stable dividend, and robust capital position are positive indicators for shareholders and may support upward share price movement. However, investors should remain aware of ongoing risks and monitor upcoming management commentary for additional guidance.
Upcoming Event
Trustmark Q2 2026 Results Conference Call: July 29, 2026, at 8:30 a.m. Central Time. Details are available on Trustmark’s investor relations website.
Disclaimer: This article is for informational purposes only and does not constitute investment advice. Investors should review the full financial statements and disclosures and consult with their financial advisor before making investment decisions.