CTS Corporation Delivers Strong Q2 2026 Results, Emphasizes Diversified Growth and Strategic M&A
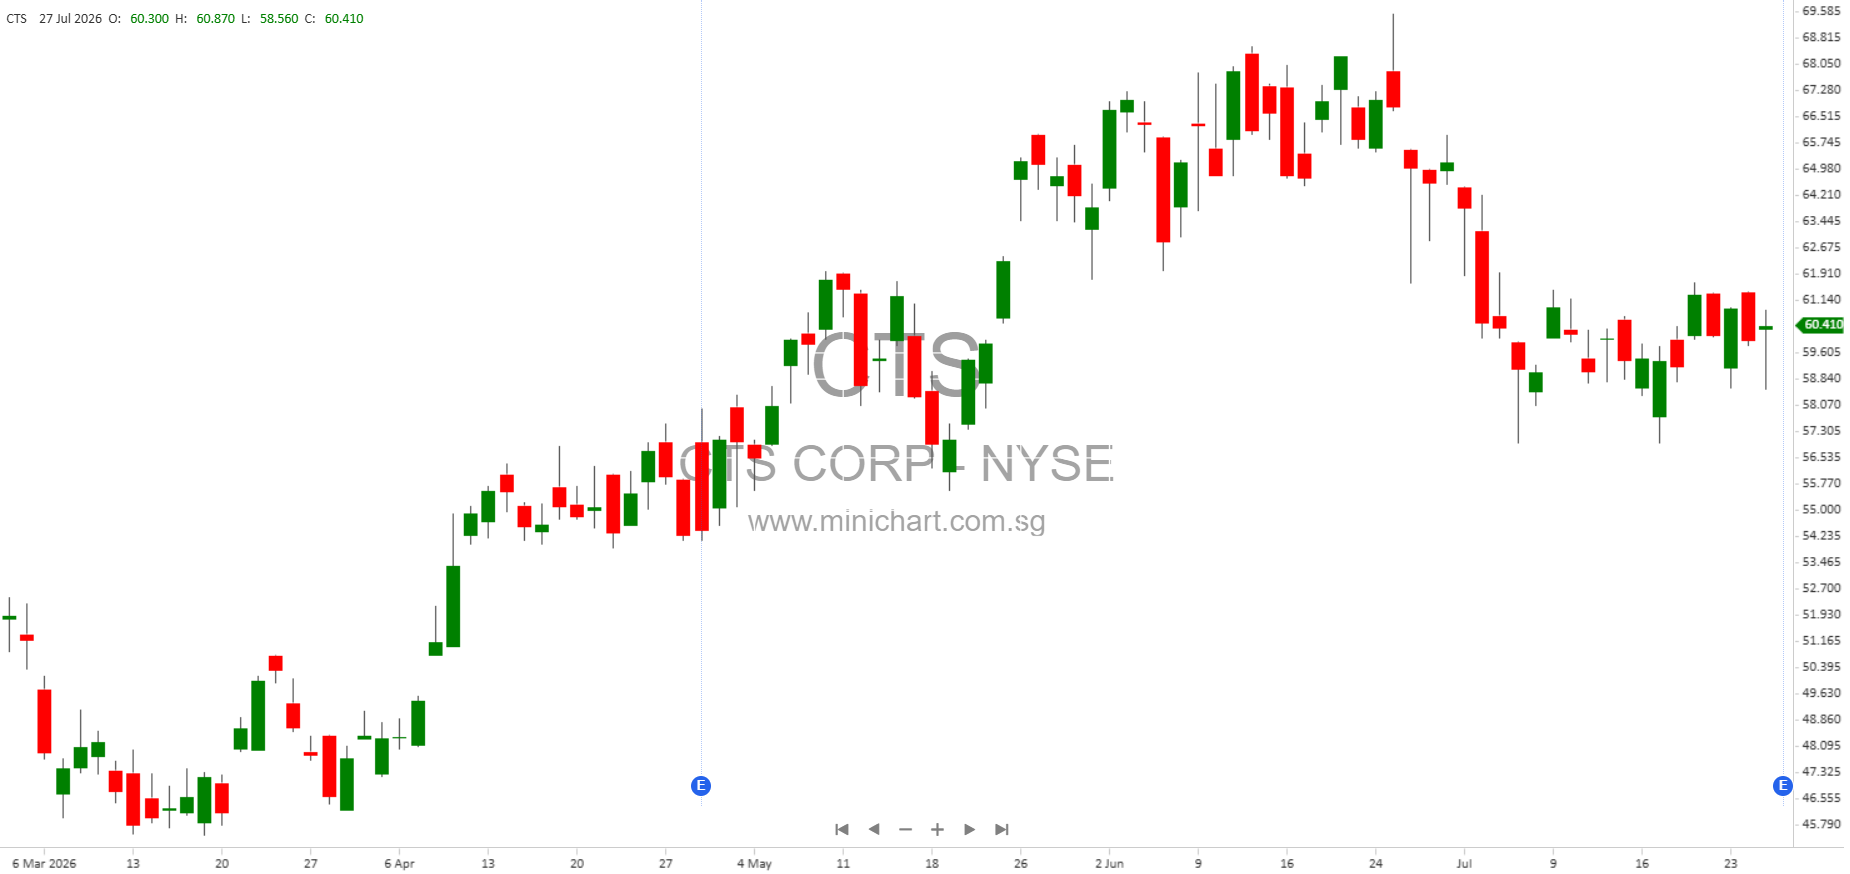
CTS Corporation (NYSE: CTS) has released its Investor Presentation for July 2026, reporting robust performance, strategic growth initiatives, and an optimistic outlook for the remainder of the year. The company’s continued focus on end-market diversification, innovation, and disciplined capital allocation is central to its investment case—and contains several details that may be highly relevant for shareholders and could impact share price movement.
Key Financial Highlights
- Revenue: Last Twelve Months (LTM) revenue totaled \$564.3 million, representing a 10% compound annual growth rate (CAGR) from 2019–2025, supported by both organic and inorganic growth initiatives.
- Adjusted EBITDA Margin: LTM Adjusted EBITDA margin stood at 24%, with a recent quarterly Adjusted EBITDA margin at 25.4%.
- Adjusted Diluted EPS: LTM Adjusted Diluted Earnings Per Share (EPS) reached \$2.58, up from \$2.23 in the prior year.
- Adjusted Net Earnings: For the LTM ending June 2026, adjusted net earnings were \$74.3 million (13.2% of sales), with net earnings of \$69.8 million (12.4% of sales).
- Free Cash Flow: For the LTM, free cash flow was \$86.4 million, with a strong operating cash flow conversion (operating cash flow as a % of adjusted EBITDA at 83%).
- Controllable Working Capital: The ratio stands at 17.6% of annualized sales, reflecting efficient capital management.
Strategic Direction and Growth Drivers
- Diversified End-Market Expansion: CTS has made significant progress in shifting its revenue mix, with diversified markets (industrial, aerospace & defense, and medical) now contributing 58% of revenue, up from 35% in 2017. The company’s strategic focus is to further grow these segments, targeting mid-single-digit organic growth.
- New Product Pipeline: CTS is leveraging its deep engineering expertise and long-standing customer relationships to drive innovation. Key new products include proprietary piezo formulations, new medical applications, and the new eBrakeTM and Drive-PadTM products for transportation, with multiple patent applications pending.
- Powertrain-Agnostic Transportation Portfolio: More than 95% of CTS’s light vehicle product portfolio is powertrain agnostic, positioning the company for resilience amid the electrification of vehicles.
- Disciplined Capital Allocation: The company has returned \$314 million to shareholders since 2013 via dividends and repurchases. Its capital allocation framework prioritizes maintaining a strong balance sheet, supporting growth capex (~4% of sales), and pursuing strategic M&A (targeting 5% of sales growth from M&A).
- Strategic M&A: CTS maintains a disciplined approach to acquisitions, focusing on strengthening customer relationships, expanding geographically, enhancing technology portfolios, and ensuring acquisitions are accretive to earnings and synergistic.
Segment and Market Performance
- Industrial: LTM revenue was \$150M (+17% YoY), benefitting from secular trends in automation, sustainability, and efficiency (e.g., heat pumps, micro-positioning, and actuation). Estimated market growth is in the mid-single digits.
- Medical: LTM revenue reached \$99M, with strong growth in ultrasound modality and superior material performance. The addressable market is \$1.5B, with mid-single-digit estimated growth.
- Aerospace & Defense: LTM revenue was \$81M (+1% YoY), with growth driven by increased defense spending and expansion in Europe. The addressable market is \$1.5B, with mid-single-digit growth anticipated.
- Transportation: LTM revenue was \$234M (-2% YoY), with the segment expected to remain flat to low single-digit growth, offset by increased content from new, powertrain-agnostic products.
2026 Financial Guidance and Outlook
- Revenue Guidance: For FY 2026, CTS expects revenue in the range of \$565–\$585 million, reflecting the continuation of current market conditions and ongoing progress in end-market diversification.
- Adjusted Diluted EPS Guidance: Projected at \$2.55–\$2.70.
- Key Assumptions: Light vehicle production is expected to be flat to slightly down, but partially offset by commercial vehicle volumes. The effective tax rate is projected between 21%–23%, excluding discrete items.
- Financial Targets:
- Long-term revenue growth: +10% per year
- Adjusted gross margin: 37–40%
- Adjusted SG&A: 15–17% of sales
- R&D: 4–6% of sales
- Capex: ~4% of sales
Risks and Forward-Looking Statements
- Risks That May Affect Share Value: The company highlights several key risks, including supply chain disruptions (especially rare earth elements and metals), economic volatility (inflation, tariffs, recession risk), integration issues related to acquisitions, funding changes in government contracts, rapid technology shifts, and geopolitical risks (notably US/China relations and tariffs). Shareholders should also note potential impacts from cybersecurity incidents and the risk of goodwill write-offs.
- No Obligation to Update: CTS explicitly states that it undertakes no obligation to publicly update forward-looking statements, even if subsequent events or changes in market conditions occur.
Shareholder Value Creation Initiatives
- Capital Returns: CTS continues to prioritize returning capital to shareholders, maintaining a disciplined approach with 20–40% of Free Cash Flow allocated to dividends and share repurchases.
- Strategic Initiatives: The company is investing in IT systems (ERP, analytics), operational excellence (CTS Business System), and strengthening its leadership and organizational capabilities to support profitable growth.
- 2030 Vision: CTS’s “Evolution 2030” plan places a strong emphasis on both organic and inorganic growth, talent development, and continuous improvement across its value chain.
Non-GAAP Financial Measures
CTS provides a detailed breakdown and reconciliation of non-GAAP measures (such as Adjusted EBITDA, Adjusted Net Earnings, and Free Cash Flow), explaining exclusions for restructuring, environmental, acquisition-related, inventory fair value, foreign exchange, pension expenses, and discrete tax items. The company believes these measures provide a clearer understanding of its operational performance, but cautions investors that non-GAAP measures should not be the sole basis for investment decisions.
Potential Price Sensitive Information
- 10% annualized revenue growth target and 24% Adjusted EBITDA margin outperformance vs. prior years underscore sustained operational improvements, which may influence market sentiment and valuation.
- Shift towards diversified end markets (now 58% of revenue) reduces exposure to the cyclical transportation sector, potentially lowering risk premiums.
- Strong new product pipeline and multiple patent applications could unlock future growth and competitive advantages.
- Ongoing strategic M&A activity and the disciplined capital allocation framework position CTS for continued expansion in attractive adjacencies, which could be accretive to shareholder value.
Disclaimer: This article is for informational purposes only and does not constitute investment advice. The content is based on data provided in CTS Corporation’s July 2026 Investor Presentation and may include forward-looking statements subject to risks and uncertainties. Investors are encouraged to review the company’s official filings and consult with their financial advisors before making investment decisions.