Midland States Bancorp, Inc. Delivers Strong Q2 2026 Results, Highlights Strategic Initiatives and Capital Strength
Key Highlights from Q2 2026 Report
- Net Income Available to Common Shareholders: \$17.7 million, with adjusted diluted EPS of \$0.82.
- Return on Average Tangible Common Equity (ROATCE): 16.27%.
- Net Interest Margin: 3.98%, up 7 basis points from the prior quarter due to a favorable shift in securities mix, higher loan yields, and declining funding costs.
- Total Assets: \$6.7 billion; Loans: \$4.2 billion; Deposits: \$5.7 billion.
- Capital Strength: CET1 ratio rose to 10.4%, exceeding management’s near-term target, and Total Capital Ratio reached 15.8%.
- Efficiency Ratio: 60.6%, improved from 62.2% in Q1 2026, reflecting enhanced operational efficiency.
- Wealth Management: Achieved record assets under administration (AUA) of \$4.78 billion and record quarterly revenue of \$8.8 million.
- Share Repurchases: \$2.7 million of common stock repurchased in Q2. \$24.9 million remains under the authorized \$45 million program expiring December 31, 2026.
- Credit Management: Continued reduction in non-core and specialty finance portfolios; net charge-offs included an \$8.6 million resolution of a nonperforming commercial real estate loan.
Strategic Initiatives and Business Transformation
- Business Mix Optimization: Ongoing reduction of non-core and specialty finance loans, now below 10% of the loan portfolio, with a strategic focus on core community banking and commercial relationships.
- Growth in Core Markets: Targeted expansion in St. Louis and Chicago, supported by investments in technology and talent.
- Tech-Forward Strategy: The bank continues to automate back-office processes using AI and RPA, invest in data analytics, and expand Fintech partnerships to boost efficiency and risk controls.
- Wealth Management Expansion: Addition of new advisors and technology tools is driving increased business development and cross-sell opportunities. Wealth referrals increased 5% quarter-over-quarter and 63% year-over-year.
- Deposit Growth: Total deposits grew by \$267.2 million in Q2, led by increases in checking and savings accounts and a deliberate reduction in higher-cost brokered deposits. The loan-to-deposit ratio fell to 74.4%, enhancing liquidity.
- Strong Liquidity: Liquidity coverage stood at 1.78x with \$4.41 billion in insured deposits and only 1% in brokered deposits. The investment portfolio remains fully available-for-sale with a 4.4-year duration and a 4.25% average yield.
Important Shareholder and Price-Sensitive Information
- Improving Profitability and Capital Returns: EPS and ROATCE both improved, supporting the bank’s commitment to shareholder value creation.
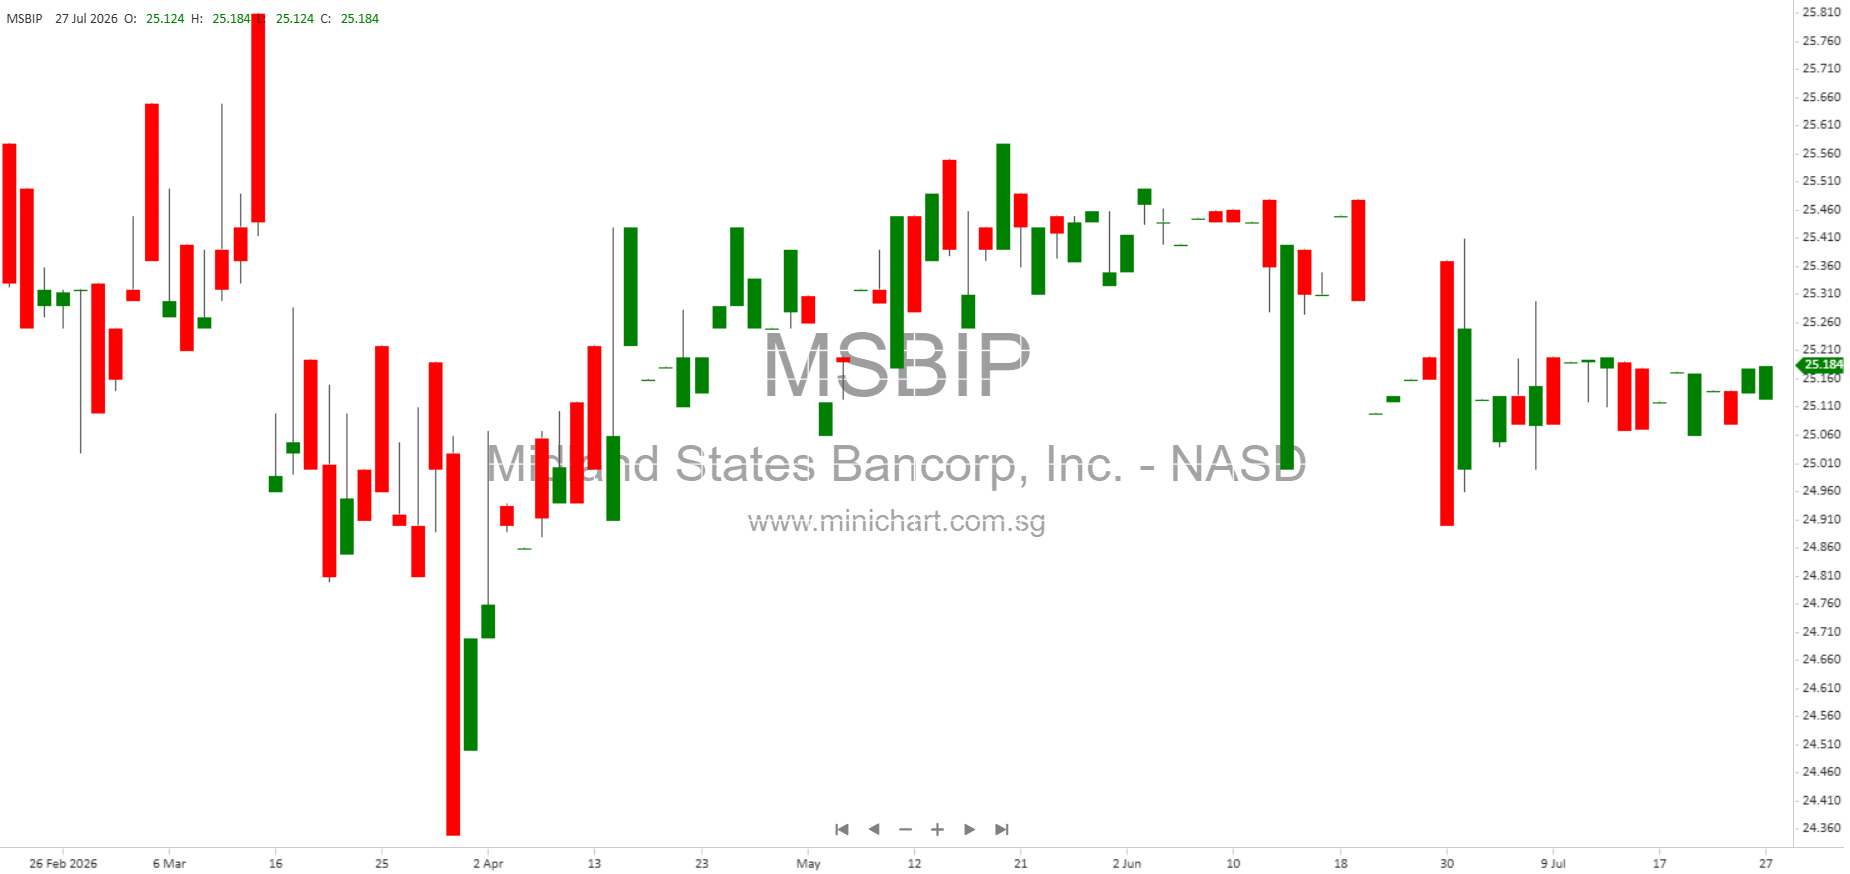
- Share Repurchase Program: The company’s ongoing share buyback program could provide support to the share price, with over \$24 million in repurchase capacity remaining.
- Credit Quality Developments: While net charge-offs rose to \$12.5 million (driven by a large commercial real estate charge-off), nonperforming assets remain flat at 0.91% of total assets, suggesting containment of credit risk. Shareholders should be aware of the ongoing reduction in riskier loan segments, which could reduce future volatility.
- Efficiency and Technology Investments: The consistent reduction in the efficiency ratio and investments in technology and talent are expected to drive further operating leverage and profitability, which could positively impact future earnings and share value.
- Regulatory and Capital Buffers: All capital ratios are well above regulatory minimums, providing flexibility for business growth and further capital returns to shareholders.
- Revenue Diversification: Noninterest income, particularly from Wealth Management and credit enhancement activities, is becoming a more significant driver of profitability, reducing reliance on traditional lending spreads.
- Potential Risks: The bank continues to work through legacy and non-core loan exposures, which could result in additional credit costs, but the scale of these exposures is declining quarter-over-quarter.
Financial and Operating Metrics
| Metric | Q2 2026 | Q1 2026 | Q2 2025 |
|---|---|---|---|
| Net Income (to common) | \$17.7M | \$16.2M | \$9.8M |
| Diluted EPS | \$0.82 | \$0.74 | \$0.44 |
| Adjusted Diluted EPS | \$0.82 | \$0.79 | \$0.48 |
| ROAA | 1.22% | 1.18% | 0.56% |
| Efficiency Ratio | 60.6% | 62.2% | 59.9% |
| CET1 Ratio | 10.4% | 10.0% | 9.6% |
| NPAs/Total Assets | 0.91% | 0.91% | 1.15% |
| Wealth AUA | \$4.78B | \$4.47B | \$4.18B |
| Book Value per Share (Tangible) | \$21.41 | \$20.77 | \$20.68 |
Outlook and Guidance
- Midland expects to continue growing its core community bank and wealth management relationships, drive fee income, and further reduce non-core credit costs.
- Capital build-up is expected to continue, with a focus on maintaining strong profitability and driving operating leverage through ongoing process and technology improvements.
- Noninterest expense run-rate is expected to be approximately \$50 million per quarter in the near term.
Industry Recognition
- 2025 Illinois SBA 504 Third-Party Lender of the Year
- 2026 Newsweek America’s Top Financial Advisory Firm for Midland Wealth Advisors
- 2026 Top Workplace Honor (fourth consecutive year)
- 2025 Illinois Community Service Award
- 2024 Finalist for Best Initiative to Promote Financial Inclusion
Conclusion
Midland States Bancorp, Inc. is showing strong momentum in earnings, capital build, and operational efficiency while strategically repositioning its business mix and investing in technology. Ongoing share repurchases, record wealth management performance, and robust capital and liquidity positions provide support for future growth and shareholder returns. Investors should monitor the continuing reduction in non-core loans and credit costs, as well as the bank’s execution on its tech-forward and relationship-focused strategy.
Disclaimer: This article is for informational purposes only and does not constitute investment advice. Readers are encouraged to review Midland States Bancorp, Inc.’s official filings and consult their own professional advisors before making investment decisions. Past performance is not indicative of future results.