Armstrong World Industries Reports Record Q2 2026 Results, Raises Full-Year Guidance
Key Highlights for Investors
- Record Q2 Net Sales and Earnings: AWI delivered double-digit net sales growth and strong earnings, with Q2 2026 net sales up 11.2% year-over-year to \$472 million and net earnings rising 10.1% to \$96.7 million.
- Adjusted EBITDA and Margins: Adjusted EBITDA increased 7.5% to \$166 million, with an adjusted EBITDA margin of 35.2%.
- Growth Across Segments: Both Mineral Fiber and Architectural Specialties segments posted robust sales growth, with the latter up 16.6% year-over-year and the former growing by 7.9%.
- Raised Full-Year Guidance: Management increased the midpoint for full-year 2026 guidance across all key metrics, reflecting confidence in business momentum.
- Share Repurchase Program Expansion: The Board approved an additional \$800 million in buyback authorization, extending the program through December 2029, with \$398 million remaining as of June 30, 2026, and \$2.5 billion total authorization.
- Strategic Acquisitions and Investments: The company highlighted the integration of recent acquisitions and ongoing investments to support growth initiatives.
Detailed Financial Performance
Consolidated Results
- Net Sales: \$472.0 million in Q2 2026, up from \$424.6 million in Q2 2025 (11.2% growth).
- Operating Income: \$133.8 million, up 8.6% from \$123.2 million a year ago; operating income margin declined slightly to 28.3% from 29.0%.
- Net Earnings: \$96.7 million, up 10.1%.
- Diluted EPS: \$2.26, an increase of 12.4% from \$2.01 in Q2 2025.
- Adjusted EBITDA: \$166 million (up 7.5%), with margin at 35.2% (down from 36.3%).
- Adjusted Net Earnings: \$101 million (up 10.3%), and adjusted EPS of \$2.36 (up 12.9%).
Segment Performance
Mineral Fiber
- Net Sales: \$288.2 million, up 7.9% (\$21 million increase), driven by \$16 million favorable AUV (Average Unit Value) and \$5 million higher volumes.
- Operating Income: \$105.3 million, up 7.0%.
- Adjusted EBITDA: \$129 million, up 6.8%.
- Operating Margin: 36.5% (down 40 bps).
Architectural Specialties
- Net Sales: \$183.8 million, up 16.6% (\$26 million increase), including \$15 million organic and \$11 million inorganic (acquisitions) growth.
- Operating Income: \$29.4 million, up 14.8%.
- Adjusted EBITDA: \$37 million, up 10.4%.
- Operating Margin: 16.0% (down 20 bps).
Cash Flow and Balance Sheet Insights
- Operating Cash Flow (YTD): \$125.9 million for the first six months, up \$3 million from the prior year.
- Investing Cash Flow (YTD): \$(44.9) million, with the increase in outflows primarily due to the Eventscape acquisition, partially offset by higher dividends from the WAVE joint venture.
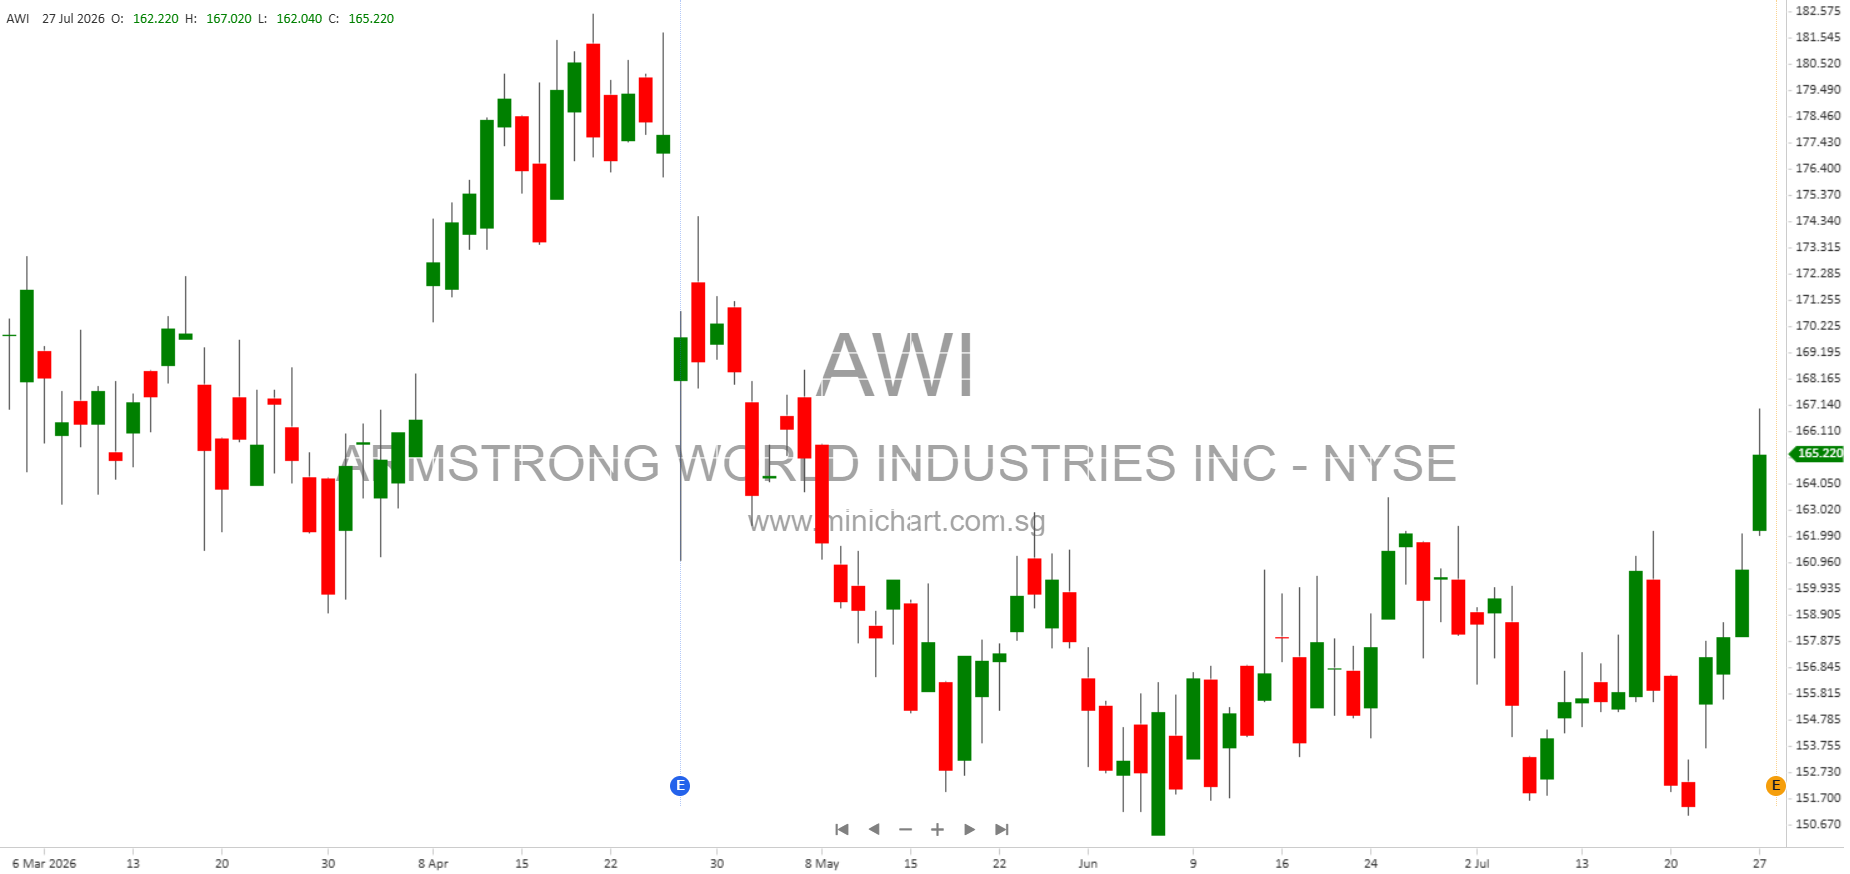
- Share Repurchases: 0.5 million shares bought in Q2 2026 for \$75 million at an average price of \$163.20/share. Since program inception, 16.2 million shares repurchased for \$1.3 billion (average price \$80.31/share).
- Balance Sheet: Total assets increased to \$2.01 billion as of June 30, 2026 (up from \$1.92 billion at year-end 2025), with shareholders’ equity at \$884 million.
2026 Guidance Update
Management has raised the midpoint for all major financial metrics for 2026:
- Net Sales: \$1.77 billion to \$1.80 billion (9-11% growth from \$1.621 billion in 2025).
- Adjusted EBITDA: \$605 million to \$620 million (9-12% growth from \$555 million).
- Adjusted Diluted EPS: \$8.30 to \$8.50 (12-15% growth from \$7.41).
- Adjusted Free Cash Flow: \$380 million to \$395 million (10-14% growth from \$346 million).
Management cited the strong Q2 performance and the durability of the business model as reasons for the increased outlook. They also highlighted continued focus on growth strategies, operational excellence, and value creation for shareholders.
Strategic and Price-Sensitive Updates
- Share Buyback Expansion: The Board’s decision to add \$800 million to the authorized repurchase program, extending it through December 2029, is a significant signal of confidence in the company’s future and capital allocation discipline. This is likely to be price-sensitive as it supports the share price and signals management’s positive outlook.
- Acquisition Integration: The contribution from recent acquisitions (including Eventscape) is supporting inorganic growth, particularly in the Architectural Specialties segment, and driving margin expansion and product diversification.
- Operating Leverage and Margin Management: The company is seeing margin benefits from volume growth and price/mix improvements, offset in part by higher SG&A and manufacturing costs, including input inflation. Cost management will remain a focus.
Risks and Forward-Looking Statements
Management noted ongoing macroeconomic and geopolitical uncertainties, which could impact future performance. Investors should consider risks associated with input cost inflation, supply chain disruptions, and the broader economic environment.
Conclusion and Investor Takeaways
- Armstrong World Industries is demonstrating strong operational performance, delivering record sales and earnings, while executing on growth and capital return strategies.
- Raised guidance and an expanded buyback program are positive signals for shareholders and could be supportive of the share price.
- Continued execution on strategic initiatives, including acquisitions and operational improvements, position AWI for further growth, though investors should monitor macroeconomic risks.
Disclaimer: This article is for informational purposes only and does not constitute investment advice. Investors should review all available information and consult their financial advisors before making investment decisions. All forward-looking statements are subject to risks as noted by Armstrong World Industries in their official filings.