American Tower Corporation Reports Robust Second Quarter 2026 Results: Major Earnings Surge, Positive Outlook, and Capital Allocation Updates
Highlights from Q2 2026 Earnings Report
- Total revenue increased by 4.7% year-over-year, reaching \$2,749 million.
- Net income surged by an impressive 133.2% to \$888 million.
- Adjusted EBITDA rose 3.2% to \$1,808 million.
- Net income attributable to common stockholders grew by 136.5% to \$868 million.
- Adjusted Funds From Operations (AFFO) per share increased by 16.0% to \$2.71.
- Free Cash Flow for the quarter was \$1,158 million.
- Distributions per share for Q2 2026 were \$1.79, up 5.3% year-over-year.
- Aggregate dividend payout in Q2 2026 was \$834.1 million.
- Total capital expenditures during the quarter were \$329 million.
- Net cash position: Cash and cash equivalents stood at \$1,763 million as of June 30, 2026.
- Full-Year 2026 Outlook: Net income guidance raised to \$3.27–\$3.35 billion; AFFO guidance set at \$5.14–\$5.22 billion.
Key Details and Analysis
1. Massive Net Income and Earnings Upswing
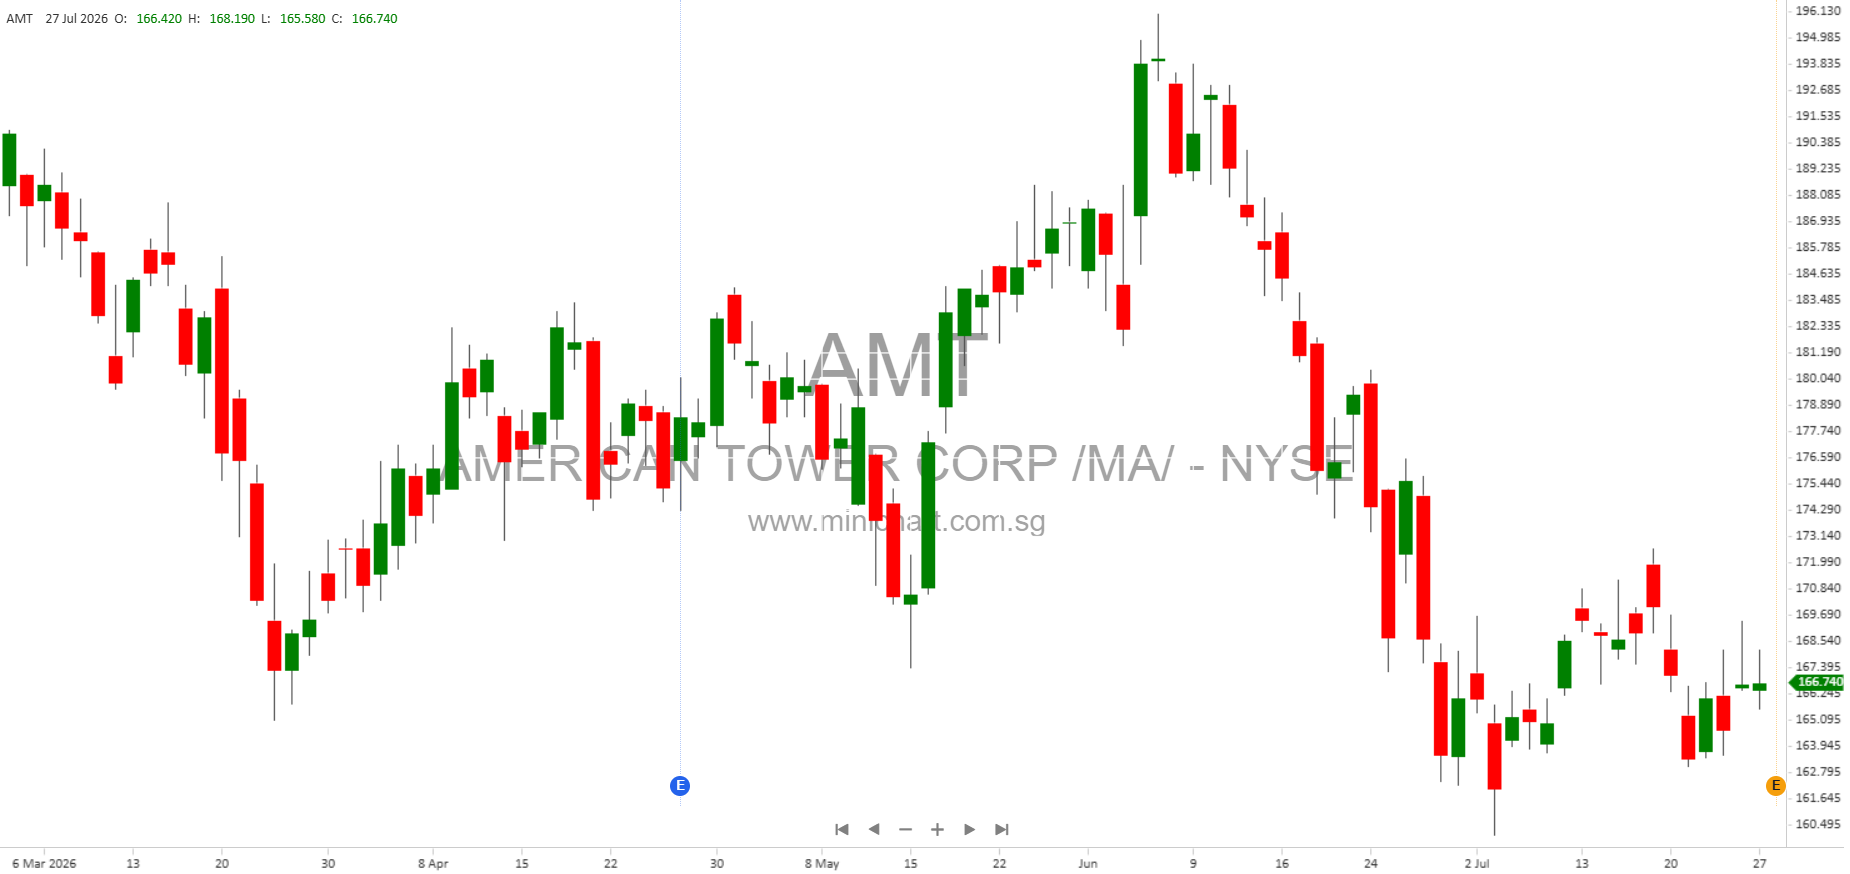
American Tower Corporation (AMT) delivered a standout quarter, with net income soaring 133.2% to \$888 million. This jump was partly driven by positive foreign currency gains of \$42.1 million, compared to substantial losses in the prior period. Net income attributable to common stockholders was \$868 million, up 136.5% year-over-year. Diluted EPS (earnings per share) and related metrics also saw double-digit growth.
2. Resilient Revenue and Strong Cash Flow
Total revenues reached \$2.75 billion, up 4.7% from the prior year. Adjusted EBITDA (a key profitability metric for REITs) grew to \$1.81 billion, with a margin rate of 65.8%. AFFO per share—a critical measure for dividend-paying REITs—rose 16.0% to \$2.71, reflecting robust underlying cash generation.
3. Dividend and Capital Return to Shareholders
- The company declared a quarterly cash distribution of \$1.79 per share, paid July 13, 2026, representing a 5.3% year-over-year increase and an aggregate payout of \$834.1 million for Q2.
- This steady, growing dividend is a direct benefit to shareholders and a key signal of financial strength.
4. Capital Expenditures and Investment Activity
- Q2 capital expenditures totaled \$329 million, including \$47 million for non-discretionary capital improvements and corporate expenses.
- Cash capital expenditures included \$7.9 million related to finance lease and land easement payments.
5. Balance Sheet and Leverage
- Cash and cash equivalents at quarter-end were \$1,763 million.
- Total debt remains substantial, but the company maintains ample liquidity and a net leverage ratio in line with investment-grade peers.
6. Updated Full-Year 2026 Outlook: Upward Revision
- Net income is now expected in the range of \$3,270–\$3,350 million (up from prior guidance), representing a midpoint growth rate of 28.1% over 2025.
- AFFO is forecast in the range of \$5,135–\$5,215 million, or \$11.00–\$11.17 per share—both raised from previous estimates.
- Adjusted EBITDA is targeted at \$7,310 million, reflecting ongoing operating strength.
- Guidance reflects continued strong leasing demand, disciplined capital allocation, and favorable currency translation effects.
Shareholder and Market Implications
- Surge in net income and AFFO per share is likely to be viewed very positively by investors, potentially supporting share price appreciation.
- Dividend growth outpacing inflation signals management’s confidence and financial health.
- Upward revision to full-year guidance is a clear price-sensitive event, as it demonstrates the company is outperforming expectations.
- Foreign currency movements had a significant positive impact this quarter; investors should monitor FX trends in future periods.
- Capital structure remains robust, with continued investment in growth and returns to shareholders.
Conference Call Information
Management will host a conference call at 8:30 a.m. ET to discuss the results and updated outlook. Supplemental materials are available on the company’s investor relations website.
Important Notice
The company cautions that this report contains forward-looking statements, which are subject to risks and uncertainties, including leasing demand, customer creditworthiness, and currency fluctuations. Investors should review the “Risk Factors” section in the company’s latest SEC filings for more details.
Disclaimer: This article is for informational purposes only and does not constitute investment advice. Financial figures quoted are based on company filings and may be subject to adjustments. Investors should conduct their own analysis and consult with financial advisors before making investment decisions. All forward-looking statements are subject to risks as outlined in the company’s public filings.