Martin Midstream Partners L.P. Reports Q2 2026 Financial Results
Key Highlights for Investors
- Quarterly Report: Martin Midstream Partners L.P. (NASDAQ: MMLP) filed its Form 10-Q for the quarter ended June 30, 2026.
- Financial Position:
- Total assets stood at \$547.4 million as of June 30, 2026, up from \$522.4 million at December 31, 2025.
- Total liabilities were \$637.6 million, compared to \$608.2 million at year-end 2025, indicating an increase in overall debt and obligations.
- Partners’ capital (deficit) showed a significant negative balance, with a deficit of \$(85.8) million for general partners, an important red flag regarding the partnership’s equity position.
- Cash Position:
- Cash on hand increased slightly to \$50,000 (in thousands) versus \$49,000 at the end of 2025.
Quarterly Performance Analysis
Income Statement Overview
- Revenues:
- Q2 2026 revenue reached \$92.3 million for the three months ended June 30, 2026, up from \$84.5 million for the same period in 2025.
- For the six months ended June 30, 2026, revenue was \$180.1 million, compared to \$167.6 million in 2025, indicating moderate growth in top-line performance.
- Costs and Expenses:
- Cost of goods and services sold for the six months in 2026 was \$197.1 million, up from \$187.8 million in 2025, reflecting inflationary pressures or higher input costs.
- Operating costs and expenses totaled \$135.8 million for the first half of 2026 (vs. \$128.8 million in 2025).
- Selling, general and administrative expenses were \$22.7 million for the six-month period (vs. \$22.3 million in 2025).
- Total costs and expenses for the six months ended June 30, 2026, were \$345.0 million, up from \$338.9 million in the prior year.
- Operating Income:
- Operating income for the six months ended June 30, 2026, was \$27.3 million, a decline from \$29.3 million in 2025, highlighting some margin compression despite increased revenue.
- Interest Expense:
- Interest expense remains a significant drag, totaling \$28.5 million for the six months (vs. \$28.7 million in 2025).
- Net Income (Loss) Before Taxes:
- Net income before taxes for the six months ended June 30, 2026, was \$4.5 million, down from \$5.2 million in the prior year, reflecting higher non-operating expenses and equity losses from investees.
- Equity Investment Loss:
- The partnership recorded equity losses from DSM Semichem LLC of \$(561,000) for the six months ended June 30, 2026, compared to \$(825,000) in 2025.
- Gain on Disposition of Assets:
- Notably, the company realized a gain of \$4.99 million from the disposition or sale of property, plant, and equipment for the six months, compared to \$1.09 million in the same period last year—a potentially price-sensitive item signaling asset sales or optimization efforts.
Strategic and Forward-Looking Statements
The company has issued forward-looking statements regarding future operations, strategic objectives, and economic performance. Management warned that actual results may differ materially due to risks and uncertainties, including those outlined in the company’s most recent 10-K and other filings. Investors are advised to monitor any updates regarding risk factors, commitments, and contingencies.
Key Items for Shareholders and Potential Price-Moving News
- Negative Equity Position: The continued deficit in partners’ capital is a critical signal of financial stress, which could impact future borrowing, distributions, or even threaten compliance with debt covenants. This is likely to be viewed negatively by the market unless addressed.
- Increased Liabilities: The rise in total liabilities outpacing asset growth may raise questions about leverage and long-term solvency.
- Asset Sales: The substantial gain from asset sales is noteworthy. While it boosts profits in the short term, it may also reflect a shift in asset strategy or potential divestitures, which could affect future revenue streams and partnership valuation.
- Revenue Growth vs. Margin Pressure: Despite top-line revenue growth, profitability remains under pressure from rising costs and high interest expenses—a key area for investor focus.
- Interest Expense: Persistent high interest expense continues to be a structural hurdle, potentially limiting the company’s ability to invest in growth or return capital to unitholders.
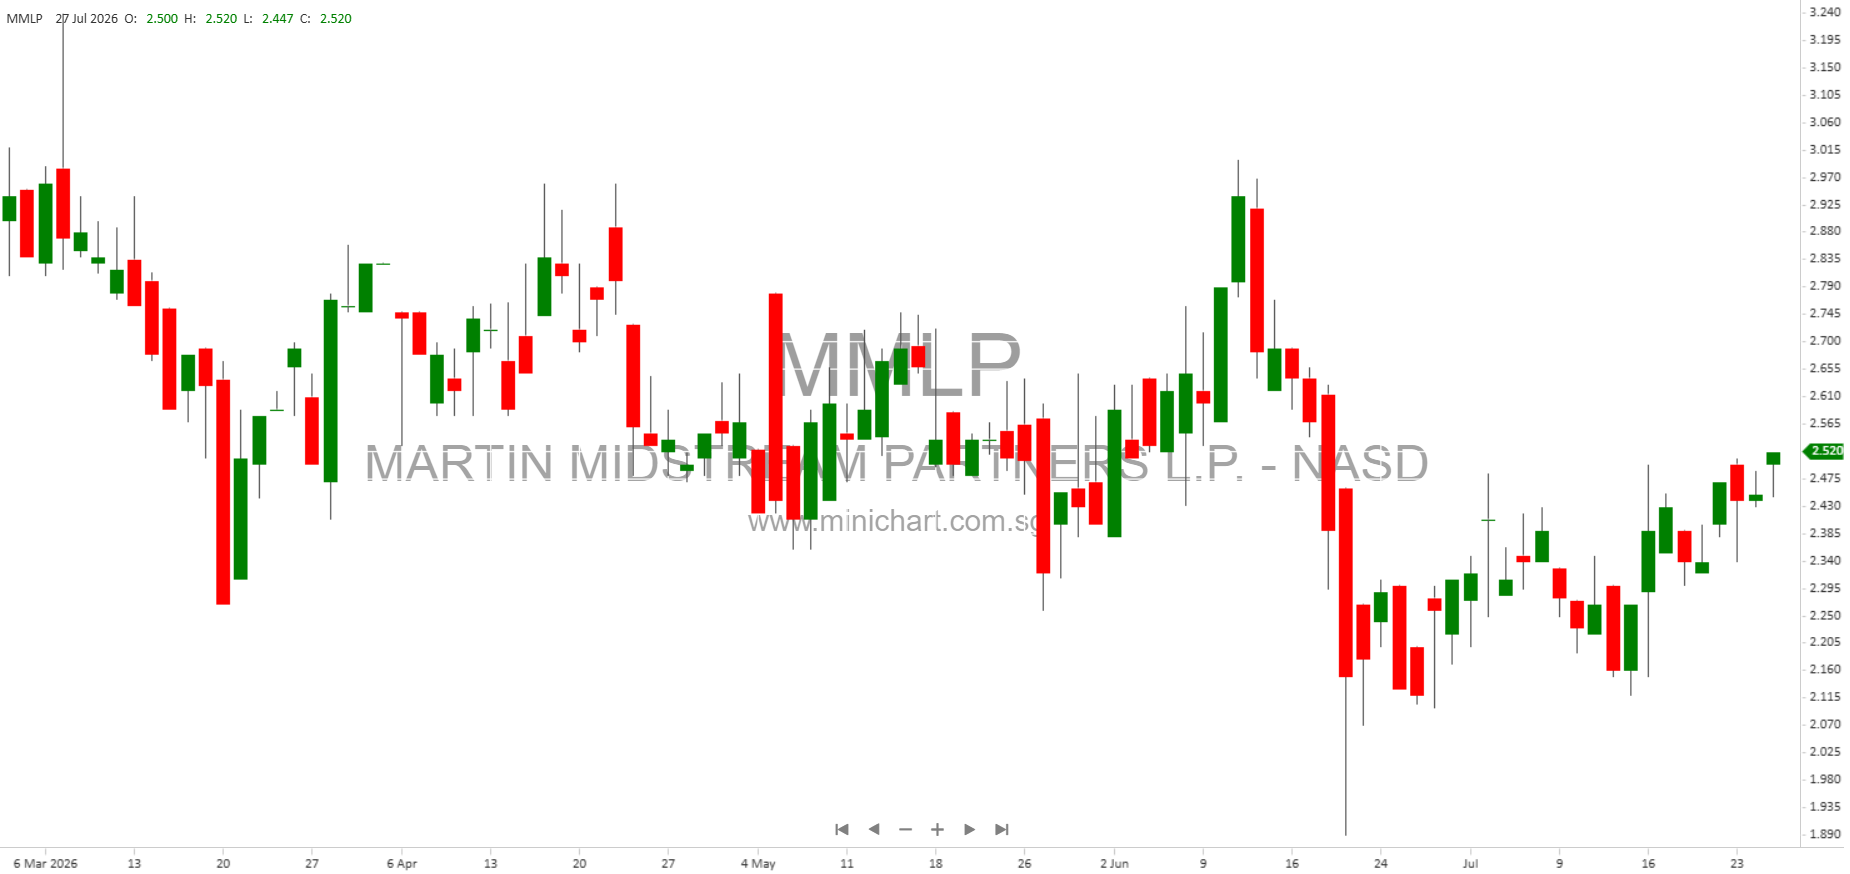
- Market Listing: The company’s common units continue to be listed and traded on The NASDAQ Global Select Market under the ticker MMLP.
Conclusion
Martin Midstream Partners L.P. delivered moderate revenue growth in Q2 2026 but faces significant challenges, including a negative partners’ capital position, increasing leverage, and persistent cost pressures. Investors should closely monitor management’s actions regarding its debt and equity structure, as well as any further asset sales or strategic realignments. The gain on asset sales is a positive short-term development but may have long-term implications for the partnership’s asset base and earnings power.
Disclaimer: This article is for informational purposes only and does not constitute investment advice. Investors should review the company’s full filings and consult with a qualified financial advisor before making investment decisions. Past performance is not indicative of future results.