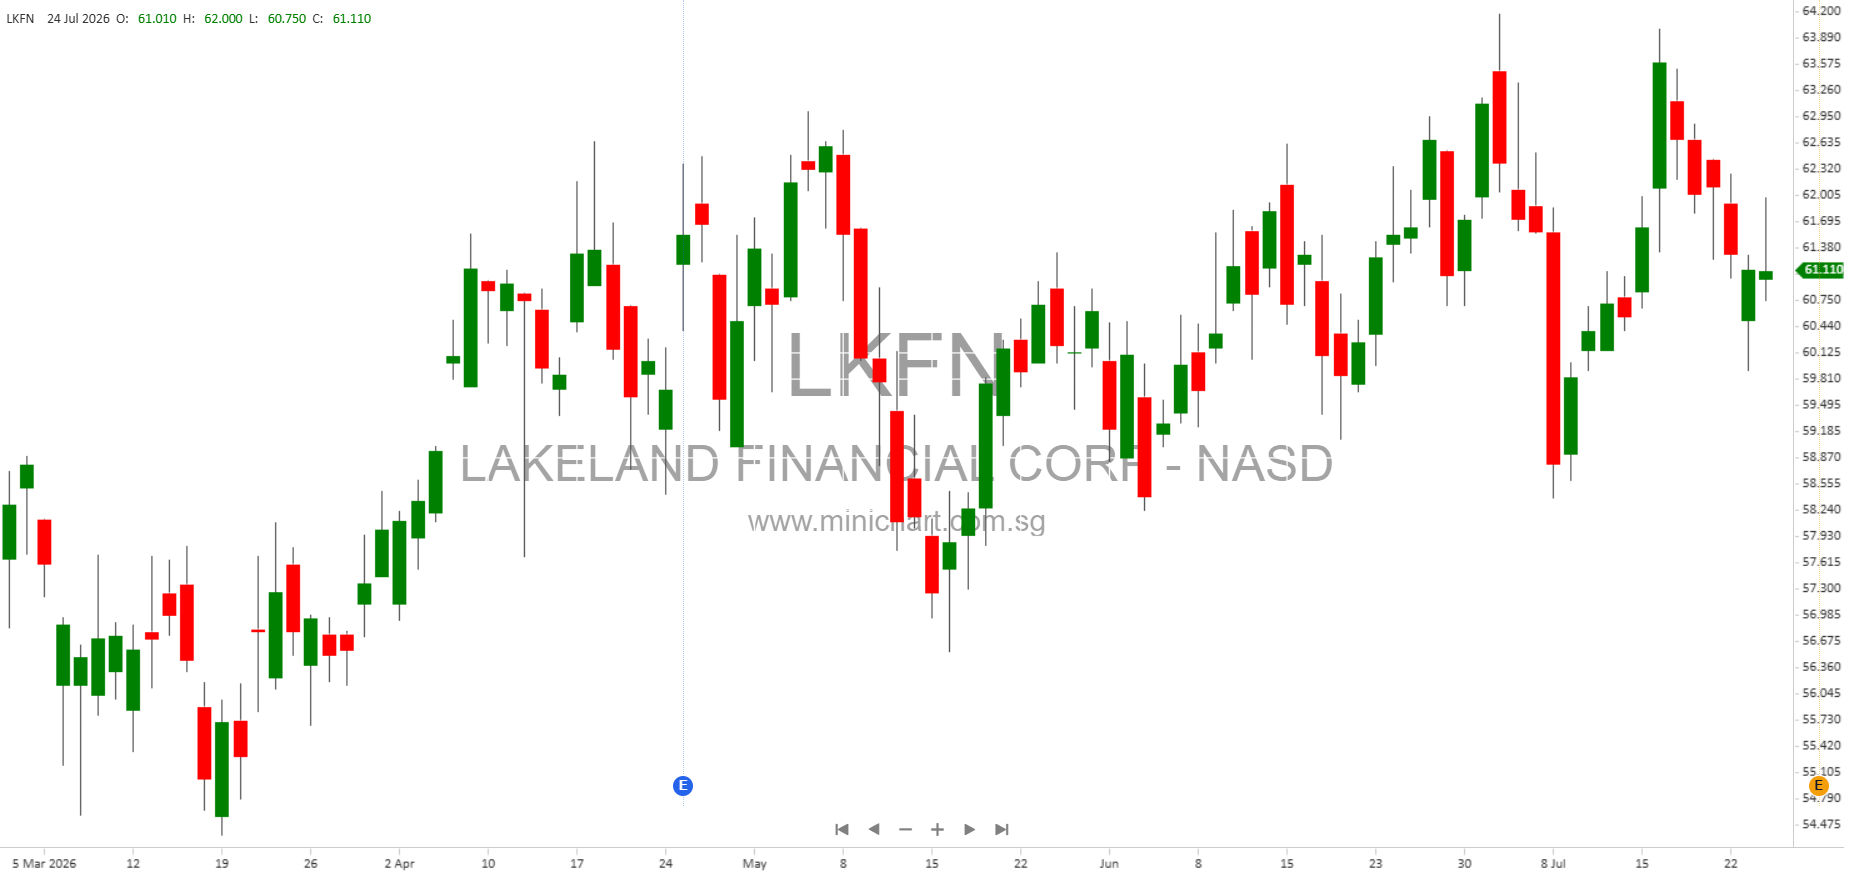
Lakeland Financial Corporation Reports Record Q2 2026 Results: Strong Growth in Loans, Revenue, and Capital
Highlights for Shareholders and Investors
- Record Net Income and EPS: Q2 2026 net income reached \$28.4 million, up 5% year-over-year. Diluted EPS at \$1.13, a 9% increase, marking record quarterly highs.
- First Half Performance: Net income for the first half was \$54.9 million, up 17% compared to 2025. Diluted EPS for H1 2026 rose 19% to \$2.17.
- Revenue Expansion: Q2 2026 total revenue grew 7% YoY to \$70.9 million. Revenue for the first six months increased 8% YoY to \$140.6 million.
- Loan Growth: Total loans grew by \$352.8 million, or 7% YoY, to \$5.58 billion. Both commercial and consumer segments saw robust increases, including 10% growth in commercial and industrial loans and 16% in consumer 1-4 family mortgage loans.
- Deposit Growth and Mix: Total deposits increased 2% YoY to \$6.33 billion. Core deposits represented 95% of total deposits, with notable 7% growth in public funds deposits. Brokered deposits nearly doubled.
- Capital Strength: Total risk-based capital ratio was 15.61%, and tangible common equity to tangible assets improved to 10.63%. Tangible book value per share grew by 12% YoY to \$30.75.
- Share Repurchases: 70,873 shares repurchased in Q2 at a weighted average of \$58.20 per share, with \$17.1 million remaining under the current repurchase authorization.
- Dividend Increase: Quarterly dividend raised to \$0.52 per share, a 4% increase YoY.
- Asset Quality: Nonperforming assets declined 36% YoY to \$20 million. Allowance for credit losses steady at 1.27% of loans. Net charge-offs were negligible after a large charge-off in Q2 2025.
- Noninterest Income: Up 9% YoY in Q2 (to \$12.6 million), and 14% for the first six months. Wealth advisory, loan fees, and bank-owned life insurance all contributed to growth.
- Noninterest Expense: Rose 13% YoY in Q2, mainly due to higher salaries, incentives, and technology investments. The efficiency ratio was 48.6% in Q2 2026, higher than Q2 2025, but improved sequentially due to strong revenue growth.
- Outlook: Management notes continued strong loan demand, robust capital, and technology investments, with a neutral interest rate posture and balance sheet strength positioning the company for further growth.
Detailed Analysis
Financial Performance
Lakeland Financial Corporation, parent of Lake City Bank (Nasdaq: LKFN), reported record net income of \$28.4 million for Q2 2026, up 5% from \$27.0 million in Q2 2025. Diluted EPS set a new Q2 record at \$1.13, up 9% from \$1.04. Net income also increased 7% sequentially from Q1 2026. For the first half of 2026, net income reached \$54.9 million, a 17% jump from \$47.1 million in 2025, with diluted EPS up 19% to \$2.17.
Revenue growth was robust, with Q2 2026 total revenue at \$70.9 million (up 7% YoY) and H1 2026 revenue at \$140.6 million (up 8%). Net interest income increased 6% YoY to \$58.3 million in Q2, and noninterest income climbed 9% to \$12.6 million. Management attributed performance to strong operating results, healthy loan and revenue growth, and effective execution of the company’s organic growth strategy.
Loan and Deposit Growth
Loans: Total loans at June 30, 2026, stood at \$5.58 billion, up 7% YoY and 2% sequentially. Growth was driven by commercial and industrial loans (+10% YoY), consumer 1-4 family mortgages (+16% YoY), commercial real estate and multi-family residential loans (+3% YoY), and other commercial and consumer loans. On a linked quarter basis, commercial and industrial loans rose 4%, and consumer mortgages 5%, while agri-business loans declined 9%.
Commercial loan originations for Q2 were about \$504 million, offset by \$427 million in paydowns. Utilization of commercial and industrial credit lines increased to 43%, up from 40% a year ago, signaling rising business activity.
Deposits: Total deposits reached \$6.33 billion, up 2% YoY and 2% sequentially. Core deposits (excluding brokered) comprised 95% of total deposits. Public funds deposits grew 7% YoY to \$2.15 billion, while retail deposits rose 1%. Commercial deposits fell 6%. Brokered deposits nearly doubled YoY (+99%) to \$299 million. On a quarterly basis, core deposits rose 4% (\$215.7 million), mainly from seasonal growth in public funds.
Average interest-bearing deposits increased by 5% YoY, driven by higher time deposits and checking accounts. Noninterest bearing demand deposits declined slightly.
Margin and Capital
The net interest margin (NIM) for Q2 2026 was 3.49%, improved by 7 basis points YoY, thanks to reduced funding costs (interest expense as a % of earning assets down 25bps) that outpaced a slight decline in asset yields. NIM was flat sequentially. Management expects the steepening yield curve and a neutral rate posture to favor future margins.
Capital ratios remain robust: Total risk-based capital at 15.61%, tangible common equity to tangible assets at 10.63%, and adjusted tangible common equity to adjusted tangible assets at 12.14%. The company remains well above the regulatory “well-capitalized” threshold.
The company repurchased 70,873 shares in Q2 at an average of \$58.20 per share, with \$17.1 million of repurchase authority remaining. The quarterly dividend was raised to \$0.52 per share, a 4% increase.
Asset Quality
Asset quality improved significantly. Nonperforming assets dropped 36% YoY to \$20 million, mainly due to the resolution of a large nonperforming credit in 2025. Nonaccrual loans fell to \$19.9 million (from \$30.6 million). The ratio of nonperforming assets to total assets improved to 0.28%. Net charge-offs were minimal at \$24,000 in Q2 2026, following a large \$28.9 million charge-off a year ago. The allowance for credit losses remains steady at 1.27% of loans.
Watch list loans as a percentage of total loans improved YoY, though there was some migration within the watch list in Q2 2026 due to credit downgrades in a few unrelated relationships.
Noninterest Income and Expense
Noninterest Income: Q2 2026 saw a 9% YoY increase to \$12.6 million, with H1 2026 up 14% to \$25.5 million. Growth was seen in wealth advisory fees (+13%), bank-owned life insurance income (+55%), and other income. Interest rate swap fees and mortgage banking also contributed. On a sequential basis, noninterest income dipped 3%, mainly due to lower swap fees and other income.
Noninterest Expense: Rose 13% YoY in Q2 to \$34.5 million, and 10% for H1 2026 to \$69.6 million. The increase was driven by higher salaries and benefits (+20% YoY), variable compensation linked to performance, and investments in technology (including AI), branches, and business development. The efficiency ratio increased to 48.6% in Q2 (from 45.9% YoY) but improved sequentially due to revenue growth.
Investment Portfolio
Investment securities grew 4% YoY to \$1.17 billion, representing 16% of total assets. The company expects \$51.9 million in principal and interest cash flows from the portfolio in H2 2026, which will be used for loan funding and reinvestment.
Unrealized losses on available-for-sale securities improved, dropping to \$140.9 million (from \$185.3 million YoY).
Strategic and Operational Updates
- The company continues to invest in technology, including AI and digital solutions, and is expanding its branch network, with two new locations under development in Indianapolis and plans for further expansion in South Bend and Fort Wayne.
- Management emphasizes a community banking model with a relationship-driven approach, supported by technology-forward solutions.
- The company’s balance sheet and capital position provide ample capacity for continued loan and asset growth.
Key Takeaways for Shareholders
- Lakeland Financial delivered record profits, robust revenue and loan growth, and strengthened its capital base, supporting further expansion and shareholder returns.
- The dividend increase and ongoing share repurchases demonstrate management’s commitment to returning value to shareholders.
- Improved asset quality and conservative risk management reduce downside risk.
- Substantial investments in technology and branch infrastructure are expected to support ongoing organic growth.
- Strong loan demand, especially in commercial and consumer segments, positions the company for sustained performance even amid changing economic conditions.
- All capital and liquidity metrics comfortably exceed regulatory requirements, indicating financial resilience.
Potential Price-Sensitive Factors
- Record quarterly and first-half results, dividend hike, and share repurchases are all potentially positive for share value.
- Sustained improvement in asset quality and reserve ratios may lead to future upgrades or positive investor sentiment.
- Continued loan growth and technology investments could drive further operational efficiency and profitability.
- Any significant changes in credit quality or loan demand, or macroeconomic headwinds, could influence future performance.
Disclaimer
This article is for informational purposes only and does not constitute investment advice or a recommendation to buy or sell any securities. Investors should conduct their own due diligence and consult with a qualified financial advisor before making investment decisions. The information presented is based on the company’s reported financial results and management commentary as of Q2 2026, and may be subject to change. Past performance is not indicative of future results.