Wyndham Hotels & Resorts, Inc. Q2 2026 Financial Report: Key Insights for Investors
Highlights of the Quarterly Report
- Quarter Ended: June 30, 2026
- Shares Outstanding: 74,211,122 as of July 15, 2026
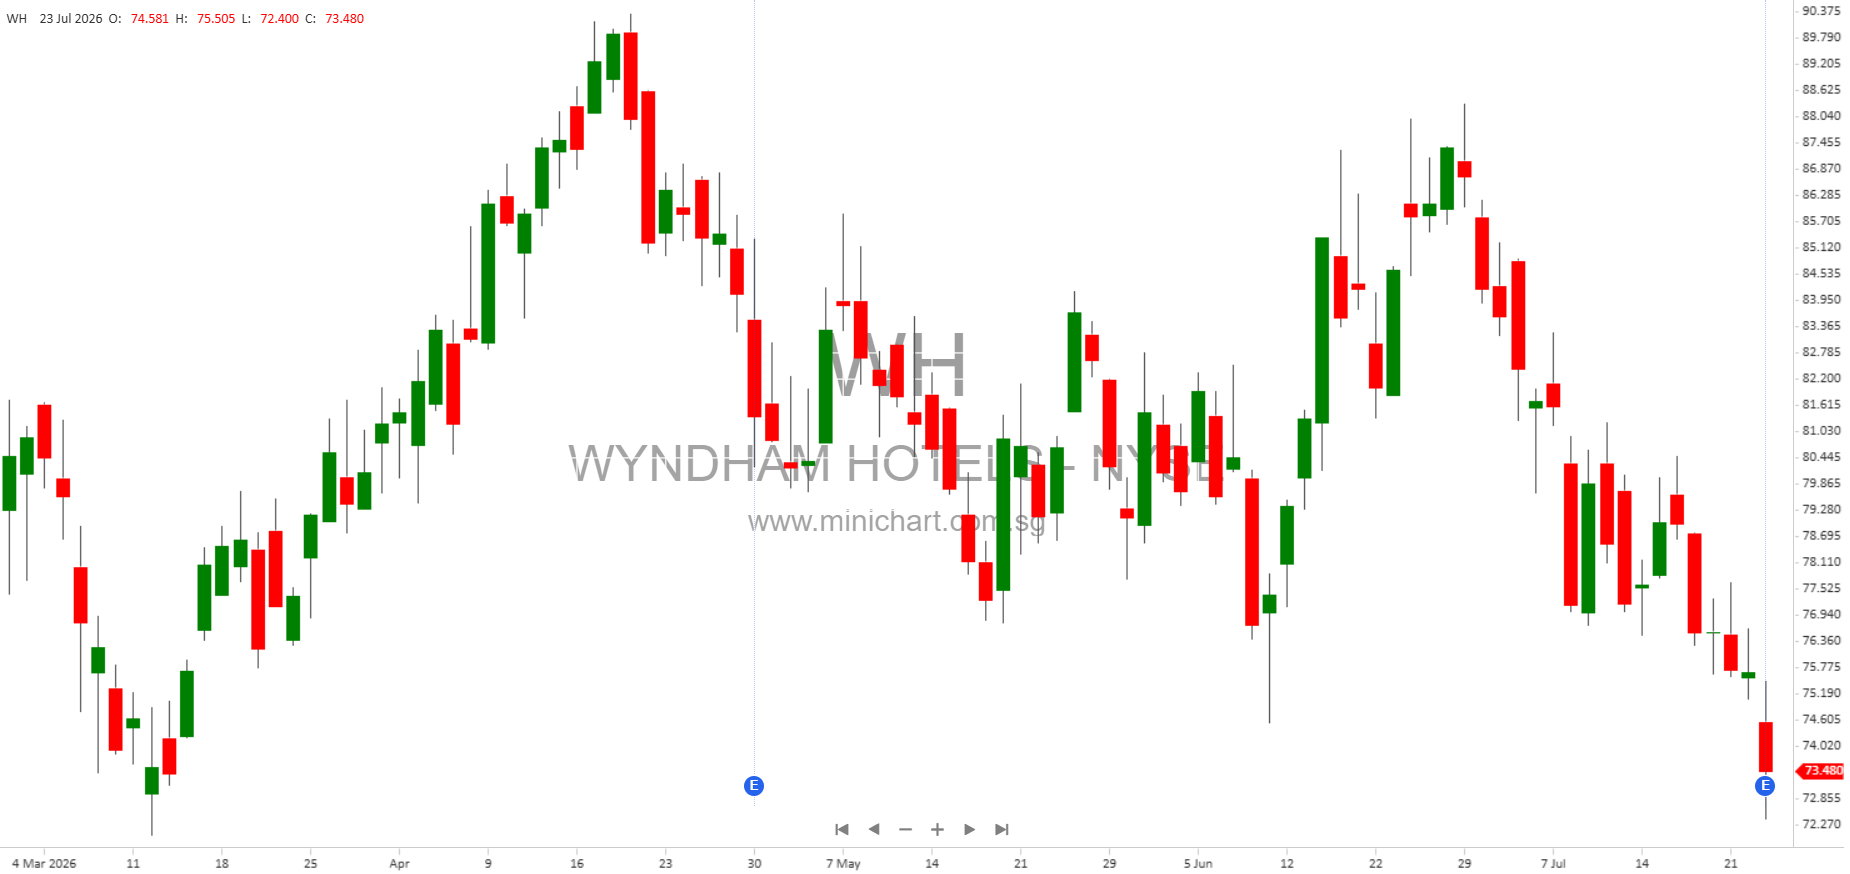
- Trading Symbol: WH (New York Stock Exchange)
- Registrant Compliance: Filed all required reports and submitted all Interactive Data Files
- Filer Status: Large Accelerated Filer
- Shell Company: Not a shell company
Financial Performance Overview
| Metric | Q2 2026 | Q2 2025 | H1 2026 | H1 2025 |
|---|---|---|---|---|
| Net Revenues | Not explicitly stated | Not explicitly stated | Not explicitly stated | Not explicitly stated |
| Operating Income | \$288 million | \$262 million | — | — |
| Net Income | \$102 million | \$87 million | \$163 million | \$149 million |
| Earnings Per Share (Basic) | \$1.37 | \$1.13 | \$2.17 | \$1.92 |
| Earnings Per Share (Diluted) | \$1.36 | \$1.13 | \$2.16 | \$1.90 |
| Total Assets | \$4,332 million (June 30, 2026) | \$4,182 million (Dec 31, 2025) | ||
| Total Stockholders’ Equity | \$480 million | — | \$468 million | — |
Cash Flow Highlights
- Net cash provided by operating activities (H1 2026): \$163 million
- Net cash provided by operating activities (H1 2025): \$149 million
- Property and equipment additions: Amount not stated, but listed as an investing activity
Key Shareholder Information & Potential Price-Sensitive Factors
- Strong Profit Growth: Net income for Q2 2026 rose to \$102 million from \$87 million a year earlier, a significant 17% increase. Earnings per share (basic and diluted) also showed notable growth.
- Solid Operating Performance: Operating income increased to \$288 million in Q2 2026 from \$262 million in Q2 2025, reflecting effective cost control and possible revenue growth.
- Balance Sheet Strength: Total assets increased to \$4,332 million, up from \$4,182 million at year-end 2025, indicating expansion and investment activity. Stockholders’ equity also improved, suggesting enhanced financial stability.
- Restructuring Charges: The company recorded \$5 million in restructuring and other-related charges for Q2 2026 and \$13 million for the six months ended June 30, 2026. These charges could signal ongoing operational improvements, but may also impact near-term profitability.
- Currency and Hedging Impact: Minor losses related to foreign currency translation and cash flow hedge adjustments are reflected in the comprehensive income figures. While not large, these could become more significant if currency volatility persists.
- Treasury Stock Activity: The company repurchased common shares, increasing treasury stock at cost from \$21 million to \$126 million. This buyback activity may support share prices but should be monitored for further capital allocation decisions.
- Share-Based Compensation: \$19 million in share-based compensation was recorded in H1 2026, consistent with H1 2025, reflecting ongoing equity incentives for employees and executives.
- No Preferred Stock Outstanding: The company is authorized to issue preferred stock, but none is outstanding, which may be favorable for common shareholders.
- Commitments and Contingencies: No material commitments and contingencies were reported in the balance sheet, reducing potential risk for investors.
- Compliance and Filer Status: Wyndham Hotels & Resorts, Inc. remains a large accelerated filer and has met all SEC reporting requirements, supporting regulatory confidence.
Potential Share Price Drivers
- Profit Growth: The continued increase in net income and earnings per share positions the company favorably for share price appreciation.
- Share Buybacks: Significant treasury stock purchases may signal management confidence and could reduce share float, supporting higher share prices.
- Restructuring Activity: Ongoing restructuring charges suggest management is taking steps to optimize operations, which could drive future profitability if successful.
- Financial Stability: Growth in assets and equity enhances the company’s stability and attractiveness to investors.
- No Material Legal or Regulatory Risk: Absence of major contingencies or shell company status reduces downside risk.
Conclusion
Wyndham Hotels & Resorts, Inc. delivered strong financial results in Q2 2026, with growth in net income, earnings per share, and operating income. The company’s robust balance sheet, ongoing share buybacks, and restructuring efforts are positive signs for investors. While currency and hedging impacts are minor, continued attention to these areas is warranted. Overall, current financial performance and capital allocation strategies may provide upward momentum for the share price.