Columbia Banking System, Inc. Reports Q2 2026 Results: Growth, Efficiency, and Strategic Execution
Key Financial Highlights
- Net Income: \$208 million for Q2 2026, up 8% quarter-over-quarter and 37% year-over-year.
- Operating Net Income: \$217 million, up 4% from Q1 2026.
- Earnings Per Share (EPS): \$0.73 per diluted share (GAAP), up from \$0.66 in Q1 2026 and flat versus Q2 2025. Operating EPS was \$0.76, up from \$0.72 in the prior quarter.
- Return on Average Assets (ROAA): 1.27% (GAAP); operating ROAA at 1.33%.
- Return on Average Tangible Common Equity: 15.29% (GAAP); operating return at 15.95%.
- Net Interest Margin (NIM): 3.93%, down 3 basis points from Q1, primarily due to \$4 million in interest income reversals.
- Efficiency Ratio: Improved to 55.15% from 58.03% in Q1 2026; operating efficiency ratio further improved to 52.92%.
- Total Assets: \$65.4 billion as of June 30, 2026, slightly down from \$66.0 billion as of March 31, 2026, reflecting balance sheet optimization.
- Loan and Lease Balances: \$47.2 billion, down 1% sequentially but up 25% year-over-year, driven by Pacific Premier acquisition and commercial loan growth.
- Deposits: \$52.1 billion, down 3% sequentially, up 25% year-over-year.
Operational and Strategic Developments
- Pacific Premier Bancorp Acquisition: Fully integrated as of Q2 2026, with all cost synergies and branch consolidations completed. Acquisition drove significant year-over-year growth in assets, loans, and deposits.
- Branch Expansion: New branch in Colorado Springs and a financial hub in Las Vegas opened, supporting ongoing relationship-driven growth.
- Small Business and Retail Campaigns: Two major deposit-gathering campaigns in the first half of 2026 brought in over \$1.25 billion in new deposits and generated new SBA lending relationships, demonstrating strong franchise value and competitive positioning.
- Cost Management: Non-interest expense fell \$19 million sequentially, driven by lower merger costs and realization of acquisition-related cost savings.
Balance Sheet and Capital Management
- Liquidity: Total available liquidity of \$25.6 billion (39% of assets), including off-balance sheet lines; liquidity covers 49% of deposits and 125% of uninsured deposits.
- Investment Portfolio: Available-for-sale securities increased to \$11.1 billion due to new purchases, offsetting paydowns and portfolio value changes.
- Deposit Mix: Shift away from higher-cost brokered and wholesale public deposits, which declined significantly during the quarter, as management focused on core relationship deposits.
- Borrowings: Increased to \$4.3 billion at quarter-end, up from \$3.4 billion at Q1, supporting funding needs amidst deposit contraction (notably due to seasonal tax payments in April).
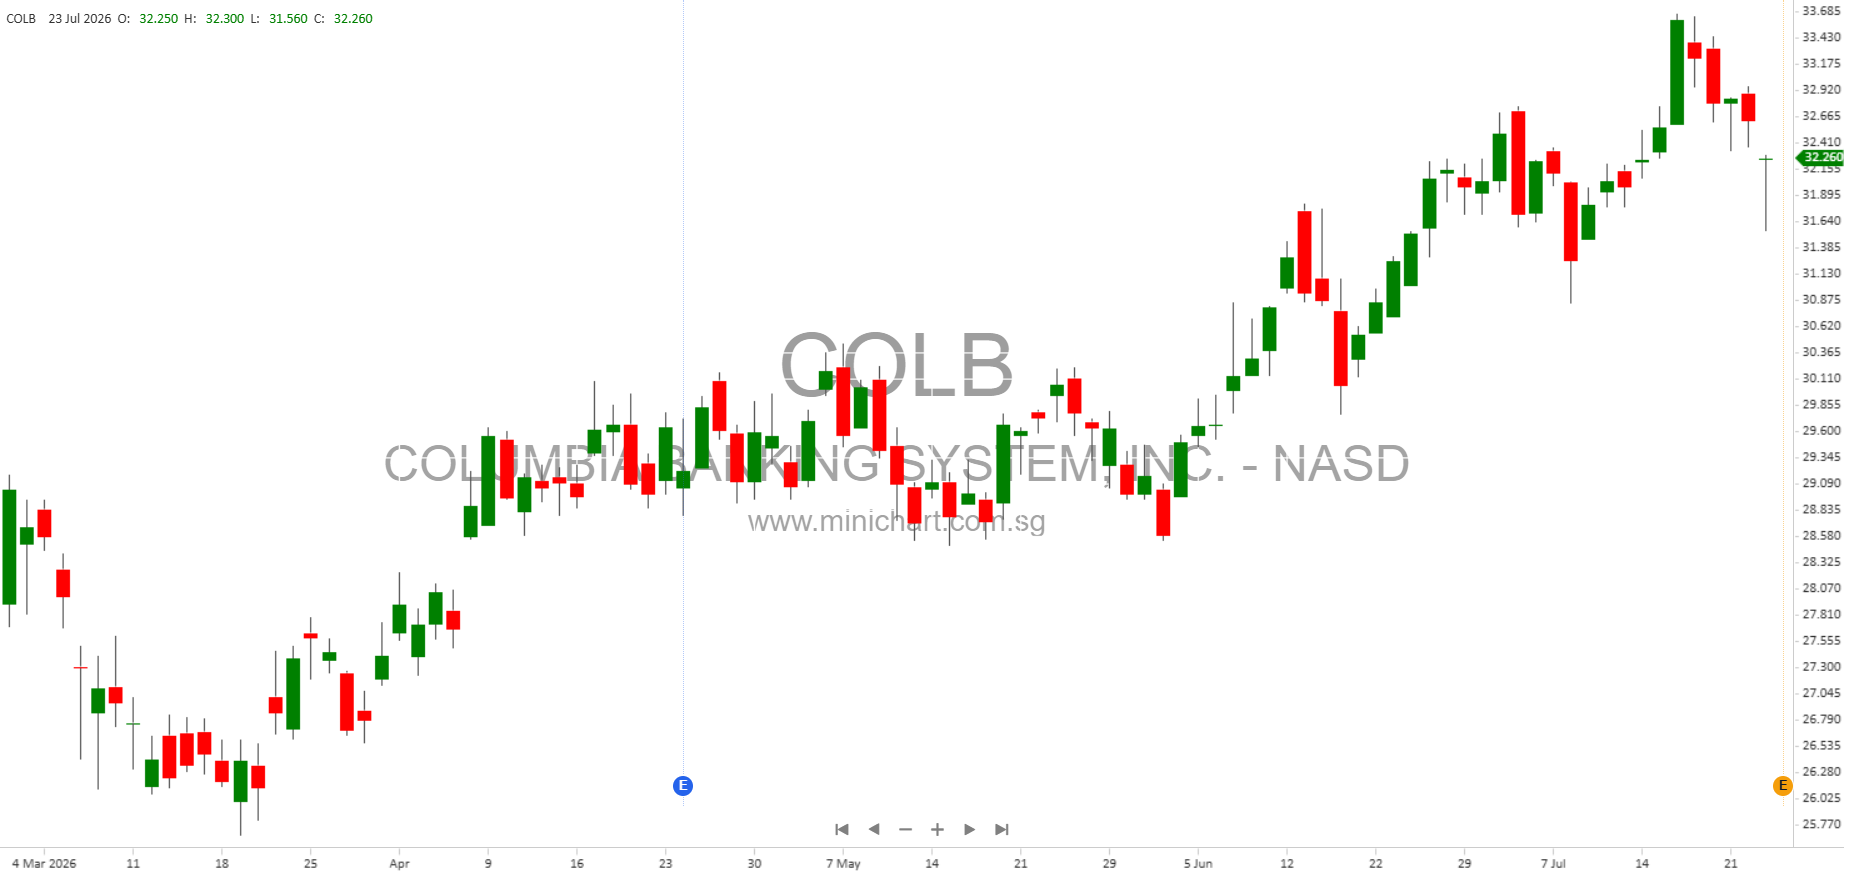
- Share Repurchases: The company repurchased 6.6 million shares (~2.3% of common stock outstanding) at an average price of \$29.93, totaling \$199 million.
- Dividend: \$0.37 per share declared and paid in Q2 2026.
- Capital Ratios: Estimated total risk-based capital ratio of 13.4% and CET1 ratio of 11.6%, both well above regulatory minimums.
- Book Value Per Share: \$26.70; tangible book value per share increased to \$19.22.
- Accumulated Other Comprehensive Loss (AOCI): Increased to \$(310) million, primarily due to net unrealized losses on available-for-sale securities.
Asset Quality and Credit Trends
- Net Charge-Offs: Annualized net charge-offs of 0.25%, improved from 0.30% in the prior quarter.
- Provision for Credit Losses: \$27 million, down slightly from \$28 million in Q1 2026.
- Allowance for Credit Losses: \$475 million, or 1.01% of loans and leases (up from \$439 million a year ago).
- Non-Performing Assets (NPA): \$273 million, or 0.42% of total assets, up slightly from 0.40% in Q1 2026, but up significantly year-over-year, reflecting portfolio runoff and economic trends.
- Commercial Real Estate: Non-owner occupied term CRE declined 7% sequentially due to elevated payoffs and competitive pricing, while owner-occupied and multifamily segments showed stability or growth.
Other Notable Items
- Non-Interest Income: Grew \$5 million sequentially, aided by higher treasury management and card-based fees, offset by \$3 million in death benefit proceeds and fair value adjustments.
- Expense Control: Operating efficiency ratio improved notably, reflecting success in managing costs post-acquisition.
- Residential Mortgage Banking: Origination and sale revenue up 20% quarter-over-quarter; servicing income down 17%.
Management Commentary
“Our second quarter results demonstrate the resilience of our franchise and reflect the value of disciplined execution across the company. While the operating environment remains dynamic, we continued to execute on our strategic priorities through prudent expense management, ongoing balance sheet optimization, and consistent capital returns to shareholders.”
“Commercial relationship growth remained solid, and the continued runoff of lower-return transactional loans is reshaping our balance sheet as intended. Customer engagement remains healthy, and we remain encouraged by the quality of our pipelines and the opportunities we see across our western footprint.”
Potential Share Price Movers & Shareholder Considerations
- Effective Execution of Pacific Premier Acquisition: All cost synergies and branch consolidations are complete, and cost savings targets have been achieved. This enhances operating leverage and earnings power.
- Strong Capital Return: Aggressive share buybacks and steady dividend growth signal management’s confidence in the franchise and capital strength, likely to be positively viewed by shareholders.
- Deposit Campaign Success: The ability to bring in over \$1.25 billion in new deposits in two campaigns in a competitive environment showcases franchise strength and could support valuation.
- Improved Cost Discipline: Significant improvement in the efficiency ratio and operating expense control post-merger are key positives for forward profitability.
- Balance Sheet Optimization: While loans and deposits contracted modestly, this was intentional and offset by better mix and lower-cost funding. However, the increase in non-performing assets and AOCI losses should be watched, though capital ratios remain strong.
- Asset Quality: Slight increase in NPAs and continued runoff in certain loan portfolios, especially non-owner occupied CRE, may be watched closely by investors given economic uncertainties.
Conference Call Details
Columbia will host its Q2 2026 earnings conference call on July 23, 2026 at 2:00 p.m. PT / 5:00 p.m. ET. Details are available on the company’s investor relations site.
Disclaimer: This article is for informational purposes only and does not constitute investment advice. Investors should review the company’s official filings and consult with their advisors before making investment decisions. Forward-looking statements are subject to risks and uncertainties, and actual results may differ materially from those expressed or implied herein.