Amalgamated Financial Corp. Delivers Record Profitability, Raises Guidance in Q2 2026
Key Highlights for Investors
- Record Net Income: Amalgamated Financial Corp. (Nasdaq: AMAL) reported net income of \$34.8 million, or \$1.15 per diluted share, for the second quarter ended June 30, 2026. This represents a substantial increase from \$25.2 million, or \$0.84 per diluted share, in the previous quarter.
- Core Earnings Surge: Core net income reached \$33.1 million (\$1.10 per diluted share), up from \$24.1 million (\$0.80 per diluted share) in the prior quarter, reflecting strength in the company’s underlying operations.
- Raised Guidance: The Company raised its full-year guidance, now targeting ~1.35% annual core ROAA, ~15% annual core ROTCE, and ~4% core non-interest income. Year-end balance sheet growth is projected around 5%. Notably, technology spend growth is expected at ~18% and the core efficiency ratio is targeted at a 52% outer band.
- Strong Deposit and Loan Growth: Total deposits increased by \$280 million in Q2 to \$8.46 billion (excluding brokered deposits), while loans grew by \$115 million, with net loans receivable now at \$5.1 billion. Political deposits surged \$211.9 million (11.4%) to reach \$2.1 billion—exceeding the peak seen during the 2024 presidential election cycle.
- Improving Margins: Net interest margin rose 3 basis points to 3.78%. Net interest income grew by \$5.9 million (7.4%) to \$86.1 million for the quarter.
- Balance Sheet Strength: The Company ended the quarter with a tangible book value per share of \$27.47 (up 3.3% quarter-over-quarter), a Tier 1 leverage ratio of 9.20%, and a Common Equity Tier 1 ratio of 14.20%. Tangible common equity ratio stands at 8.74%.
- Capital Actions: The Board approved a \$40 million share repurchase program on June 9, 2026, and paid a dividend of \$0.17 per share (\$5.2 million total) during the quarter.
- Credit Quality: Allowance for credit losses on loans increased slightly by \$0.7 million to \$68.9 million. The ratio of allowance to total loans remains stable at 1.34%. Net charge-offs were primarily in consumer solar loans (\$3.0 million) and small business C&I loans (\$0.2 million).
- Liquidity and Asset Quality: Cash, borrowing capacity, and unpledged securities totaled \$4.8 billion, covering 100% of uninsured deposits. The liquidity coverage of uninsured, non-supercore deposits is at 171.3%. Non-performing assets to total assets stand at 1.09%.
- Non-GAAP Metrics: Core return on average tangible common equity was 16.51%, and core return on average assets was 1.42%, underscoring robust profitability.
- Strategic Technology Investments: The Company accelerated AI and technology adoption, modernizing pipeline tracking, onboarding, compliance, and data frameworks. All employees now have access to AI tools, and an AI Steering Committee oversees responsible use and risk management. This investment is expected to drive scalable efficiency and improved customer outcomes.
Details for Shareholders
- Share Repurchase Program: The new \$40 million buyback initiative signals management’s confidence in the Company’s valuation and future prospects. This action may provide downside support for the share price and is a material, price-sensitive event for investors.
- Dividend Policy: The quarterly dividend of \$0.17 per share (14.9% payout ratio) reflects both strong earnings and the Company’s ongoing commitment to returning capital to shareholders.
- Political Deposits: The sharp rise in political deposits may indicate sustained franchise momentum and the ability to attract “sticky” deposit relationships, which can drive future NIM and profitability, especially heading into a major election cycle in 2028.
- Credit Quality and Asset Mix: While the allowance for loan losses is steady, investors should be mindful of the increase in nonperforming assets (notably due to a multifamily loan placed on nonaccrual status, with \$41.5M downgraded to criticized/classified). Management appears proactive in managing exposures, but this remains an area to watch.
- Liquidity: Amalgamated’s robust liquidity position (covering 100% of uninsured deposits) should reassure investors concerned about broader sector instability, particularly in light of recent industry events.
- Raised Guidance: Upward revisions to guidance are typically viewed favorably by the market and will likely be price sensitive. The Company expects to end the year at the high end of its profitability and balance sheet growth targets.
- Technology Investments: The strategic focus and measurable progress on AI and digital transformation could drive future operating leverage and margin expansion, potentially supporting a higher valuation multiple.
Financial Tables and Metrics
Key Financial Ratios (Q2 2026):
– Return on Average Assets: 1.49%
– Core Return on Average Assets (non-GAAP): 1.42%
– Return on Average Equity: 17.04%
– Core Return on Average Tangible Common Equity: 16.51%
– Net Interest Margin: 3.78%
– Efficiency Ratio: 48.10%
– Core Efficiency Ratio: 49.15%
– Tier 1 Leverage Ratio: 9.20%
– Common Equity Tier 1 Capital Ratio: 14.20%
– Tangible Book Value Per Share: \$27.47
– Book Value Per Share: \$27.93
– Non-performing Assets to Total Assets: 1.09%
– Allowance for Credit Losses to Total Loans: 1.34%
Conference Call
Amalgamated will host a live conference call to discuss these results at 11:00 AM (Eastern) on July 23, 2026. Details are available in the press release and on the Company’s website.
Conclusion
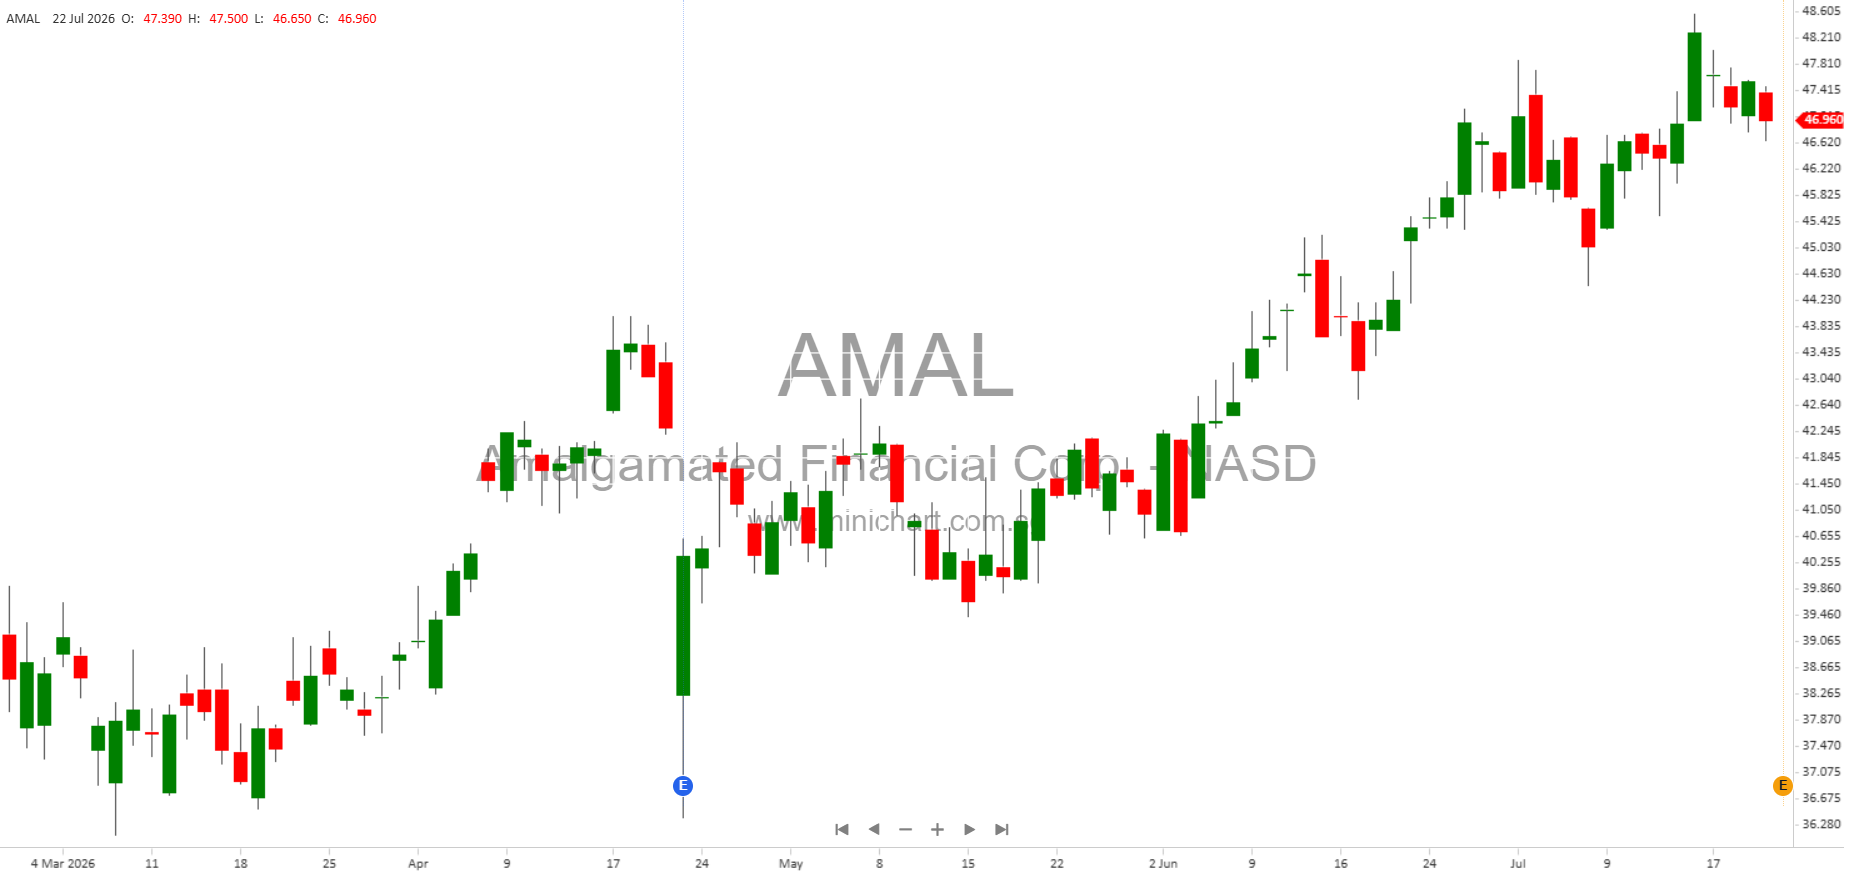
Amalgamated Financial Corp. delivered a standout quarter, posting record profitability, robust growth in deposits and loans, and raising its full-year guidance. The approval of a \$40 million share buyback and continued dividend payments highlight management’s confidence in future performance. The Company’s emphasis on AI and technology investment could yield further margin improvements and competitive advantages. The results are materially positive and likely to impact the share price favorably, though investors should monitor asset quality trends, especially in the commercial real estate segment.
Disclaimer: This article is for informational purposes only and does not constitute investment advice. Investors should conduct their own research or consult with a professional adviser before making any investment decisions. The author and publisher are not liable for any actions taken based on this information.